2022 Mid-Year Outlook: Global Stocks and Economy

Stocks around the world slumped during the first half of this year as economic uncertainty surged with the war in Europe, a lockdown-induced recession in Asia's biggest economy, stubbornly high inflation, and several major central banks pursuing the most aggressive series of policy rate increases in decades. Only the more commodity-driven markets of Canada, Australia, and the U.K. fared noticeably better than others, when measured in U.S. dollars.
Stock market losses defined the first half of 2022
Source: Charles Schwab, Bloomberg data as of 6/2/2022. Performance data provided in local currency, and in U.S. dollars. Indexes are unmanaged, do not incur management fees, costs and expenses and cannot be invested in directly. Past performance is no guarantee of future results.
Uncertainty
It's often said that markets hate uncertainty. In the first half of 2022, economic uncertainty in Europe was higher than during the height of the COVID-19 pandemic. Also, it was higher than any other time in the past two decades, except right after the Brexit referendum in June 2016, according to the Economic Policy Uncertainty indexes developed by Baker, Bloom and Davis.
Economic uncertainty index
Source: Charles Schwab, Bloomberg data as of 6/3/2022.
As the second half of the year drew near, there were some signs of easing uncertainty which seemed to help stocks rebound from their lows of mid-May.
- The war in Ukraine has shown no signs of ending, but also no signs that natural gas supplies from Russia to Europe will be cut off—an event that would likely lead to an economic recession. Economic data in Europe has remained resilient despite the conflict, perhaps due to pen-up savings from lingering COVID-induced restrictions on household spending over the past two years.
- Severe lockdowns in response to the latest COVID-19 outbreaks resulted in a sharp economic slowdown in China—the world's second largest economy—but as restrictions began to lift, economic data began to sharply rebound. As people were able to leave their homes in major cities and economic stimulus accumulated, the surprisingly big gains in China's May Purchasing Managers' Index suggest the worst of the economy's slump may be over.
- While supply chains remain stretched and delivery times are still lengthy, they have shown some signs of improvement. Inventories have been rebuilding, with some retailers such as Walmart, Kohl's, and Target reporting excess inventories in some products in May.
- Some central banks remain focused on reining in pandemic stimulus but clarified their intentions on the near-term path for rates: reducing the likelihood of 75-basis-point (bp) rate hikes from the U.S. Federal Reserve or a 50-bp hike from the European Central Bank.
While the modest easing in uncertainty was welcome news for investors in recent weeks, economic risks remain that may continue the above-average stock market volatility we had forecast for 2022.
Risks
In December of last year, our article "Top Global Risks of 2022" cites the risks that may weigh on increasingly volatile stock markets for the coming year. Stocks around the world have fallen this year mostly due to two of these risks:
- We noted the heightened risk of geopolitical conflict: "An invasion of Ukraine by Russia could prompt world powers to impose new sanctions which may elevate energy cost inflation."
- We also highlighted the risk of stagflation (a stagnant economy combined with high inflation), cautioning that: "with valuations above average in many countries, markets aren't priced for even a small risk of stagflation…leaving central banks with no good options for monetary stimulus and pushing markets into a downfall."
Concerns over a global economic recession have grown this year, due primarily to high inflation, further boosted by the war in Ukraine, and central bankers' efforts to tamp down inflation through tighter monetary policy. Economists' 2022 GDP forecasts have slumped in the first half of the year for most major countries with growth estimates cut by 1% or more, as you can see in the chart below. Canada is the exception, thanks to strong demand for its natural resources.
Economic estimates for 2022 falling
Source: Charles Schwab, Bloomberg data as of 6/1/2022.
In contrast to this weaker economic outlook, analysts have been raising earnings per share estimates. Most countries have seen earnings estimates climb meaningfully since the start of the year, as you can see in the chart below.
Earnings estimates for 2022 rising
Source: Charles Schwab, FactSet data as of 6/1/2022. Indexes are unmanaged, do not incur management fees, costs and expenses and cannot be invested in directly. Past performance is no guarantee of future results.
Europe is the exception, with the earnings growth outlook appearing to have lagged the improvements seen elsewhere. But that is largely because we are measuring earnings growth in U.S. dollars; the euro has fallen versus the dollar by more than 6% this year. Measured in euros, European earnings are now expected to climb over 13% in 2022—up eight percentage points from the start of the year, even faster than in the U.S. and mirroring the climb seen elsewhere.
It is rare to see a divergence in the direction of the economic and earnings forecasts, so why now? It isn't that economists and analysts have different outlooks, it's that they have different tasks. For example, rising energy prices in the current environment may act as a drag on the economy but may boost earnings for the energy companies that make up the indexes. Also, the current rapid growth in business investment contributes more to corporate earnings than it does economic activity.
While investors have been focused on the slowdown in the economic outlook for much of the first half of the year, the direction of earnings may be more important to stock prices than GDP for the second half. If earnings remain solid, stocks may rebound. In fact, the price-to-earnings ratio (PE) for international stocks, represented by the MSCI EAFE Index, has rarely been lower than it is today outside of a recession (the history of analysts' estimates for the next 12 months of earnings begins in 1988, allowing us to look at nearly 35 years of the forward PE ratio), as you can see in the chart below. But should we begin to see the earnings outlook deteriorate, low valuations may not protect against further declines.
International stock valuations at average of past recession lows
Source: Charles Schwab, FactSet and Bloomberg data as of 6/3/2022. Shaded areas denote recessions in Europe or Japan. Price-to-earnings (PE) based on forward 12 months consensus estimates. Forecasts contained herein are for illustrative purposes only, may be based upon proprietary research and are developed through analysis of historical public data. Past performance is no guarantee of future results.
Ideas
Investors may want to consider these investing ideas in the second half of 2022:
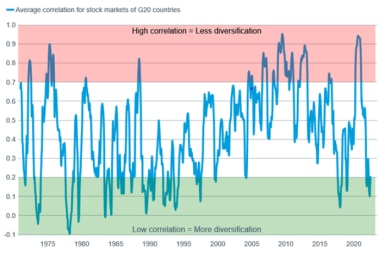
- Diversification - We have been recommending strategic weights across asset classes and sectors this year, not because we don't have any ideas but because diversification itself is an especially good idea right now in the current period of heightened volatility. The correlation across stock markets has fallen to among the lowest levels in 20 years and portfolios benefit from diversification as sectors and markets move more independently of each other.
Diversification is back
Source: Charles Schwab, Macrobond, MSCI as of 6/1/2022. MSCI Indexes for 20 countries (G20 countries) used to calculate correlation. Past performance is no guarantee of future results.
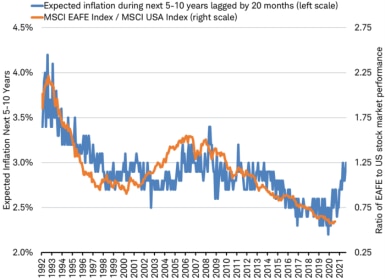
- International - Historically, when long-term inflation expectations are rising, it has led international stocks to outperform U.S. stocks. International markets tend to be more inflation sensitive, with more companies that benefit from higher inflation than those that suffer. While there can be no guarantees, international stocks have been outperforming in recent months—just as the long-term relationship forecast that it would.
Inflation expectations and international stocks relative performance
Source: Charles Schwab, Bloomberg data as of 6/3/2022. Forecasts contained herein are for illustrative purposes only, may be
based upon proprietary research and are developed through analysis of historical public data. Past performance is no guarantee of future results.
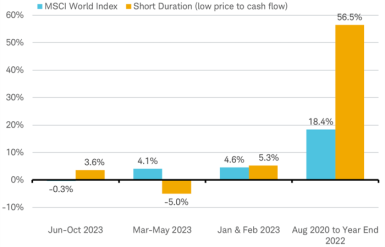
- Short duration stocks - Shorter duration stocks help manage the risk of rising rates. In other words, stocks with more immediate cash flows, rather than cash flows in the distant future, tended to outperform after rates bottomed in 2020, and are more dominant in international markets.
Short duration stocks outperforming long duration stocks
Source: Charles Schwab, FactSet data as of 6/03/2022. High price to cash flow = top 20% of stocks ranked by price to cash flow in MSCI World Index. Low price to cash flow = bottom 20% of stocks ranked by price to cash flow in MSCI World Index. Past performance is no guarantee of future returns.
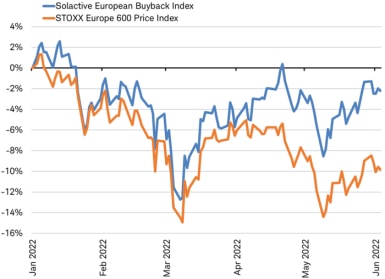
- Buybacks - As we forecast in our 2022 outlook, those companies around the world that are announcing new or increased stock buybacks seem to be benefitting from more price support than those that don't, as measured by the Solactive Buyback Indexes. These indexes track the performance of stocks whose management has announced plans to repurchase shares within the prior two months. In general, buybacks are seen by investors as a sign that a company has good cash flow and a strong balance sheet. These indicators are usually considered hallmarks of a high-quality company.
Buyback stocks outperforming
Source: Charles Schwab, Bloomberg data as of 6/3/2022. Past performance is no guarantee of future returns.
- Guard against gluts – Potential supply gluts could be forming. Shortages can cost companies growth opportunities, but gluts can negatively impact earnings expectations as demand and prices fall. Keeping an eye on inventories can be crucial to determining when and where gluts may form.
Economic uncertainty may have peaked in the first half of 2022, but it remains high. Having a well-balanced, diversified portfolio, with a risk profile consistent with your goals, and being prepared with a plan in the event of an unexpected outcome are keys to successful investing.
Michelle Gibley, CFA®, Director of International Research, and Heather O’Leary, Senior Global Investment Research Analyst, contributed to this report.
 By
By
