Bond Market Reset: What's Next?
After years of low nominal and negative real interest rates, markets are resetting for an era of higher inflation. Major central banks are hiking interest rates rapidly and shrinking their balance sheets in an effort to "normalize" policy. The question hanging over the market is, “What is a normal policy rate?”
The Federal Reserve estimates that the “neutral rate”—one that is neither too restrictive nor too easy—is around 2.0% to 2.5%. However, markets are uneasy that high inflation will mean that the Fed needs to exceed this rate, and have priced in a federal funds rate as high as 3% by mid-2023. What’s comes next?
Yields jump as inflation rises
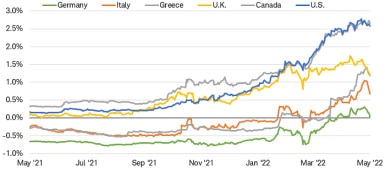
Given the economic disruptions caused by the pandemic and the Russia-Ukraine war, inflation expectations have jumped. Supply-chain disruptions, shortages of basic commodities, and sanctions have limited supplies of goods, while demand has rebounded thanks to stimulus from fiscal and monetary policies. The burst of inflation stemming from these factors caught central banks by surprise and they are scrambling to get ahead of it.
Meanwhile, markets are struggling to figure out what a logical policy rate should be in a world where inflation is at its highest levels in decades, but global growth prospects are dimming.
Global 2-year yields are rising
Source: Bloomberg. U.S. (USGG10YR Index), Germany (GTDEM2Y Index), Italy (GTIT2Y Index), Greece (GTGRD2Y Index), U.K. (GTGBP2Y Index), Canada (GTCAD2Y Index). Daily data as of 10:33 a.m. ET 5/12/2022. Past performance is no guarantee of future results.
Are we there yet?
There is an old saying that “The Fed tends to tighten policy until something breaks.” In other words, rising interest rates eventually cause the economy to falter, generally causing the most-leveraged, weakest sectors of the markets to fall. Since the Fed started signaling its intention to tighten policy at the December 2021 Federal Open Market Committee (FOMC) meeting, there have been signs of cracks. However, so far, the economy has been resilient.
In our view, now that nominal yields1 are back at pre-pandemic levels seen in 2018, we believe that much of the rise in yields for the cycle is likely behind us. However, there are several other market indicators we are monitoring to confirm a cycle top in rates.
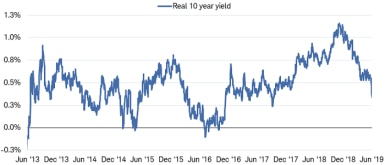
1. Real yields: Although nominal yields have rebounded sharply, real yields (adjusted for inflation) have just begun to move into positive territory after holding in negative territory for two years. At about 0.25%, 10-year real yields are about half the level that prevailed during the last period when the Fed was trying to normalize policy, from mid-2013 to 2019.
It’s worth noting that higher real yields do not necessarily require higher nominal yields. It’s the difference between nominal yields and inflation expectations that determines real yields. Therefore it’s possible that real yields will rise if inflation expectations edge lower. However, with the inflation picture so volatile, this indicator is still making us cautious.
Real 10-year yield: 2013-2019
Source: Bloomberg. US Generic Govt TII 10 Yr (USGGT10Y INDEX). Daily data from 6/1/2013 to 6/1/2019. Past performance is no guarantee of future results.
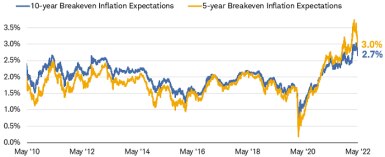
In fact, inflation expectations embedded in the Treasury Inflation-Protected Securities (TIPS) market—the breakeven rate—recently have fallen sharply as the market begins to price in a slowdown in economic activity and inflation longer term.
Market inflation expectations have fallen sharply
Source: Bloomberg. U.S. Breakeven 10 Year (USGGBE10 Index) and U.S. Breakeven 5 Year (USGGBE05 Index). Daily data as of 10:34 a.m. ET 5/12/2022. The breakeven rate is the difference between the TIPS rate and the comparable-maturity Treasury rate, and is used as a gauge for what market participants believe inflation will be five or 10 years in the future.
2. Yield curve: The yield curve—the difference between short-term and longer-term yields—has a long history of providing signals on the level and direction of rates. Historically, an inverted yield curve (where longer-term rates are lower than short-term rates) has been a reliable indicator of rising recession risk, while a steep yield curve is associated with stronger growth. Currently, the yield curve is still positively sloped, but it is likely to flatten as the Fed hikes short-term interest rates.
At past cyclical peaks, yields have tended to converge, resulting in a flat curve. Currently, the curve is still steep at the short end but if the Fed follows through on its plans to raise the fed funds rate rapidly this year, the flattening could signal an approaching peak in rates.
In past cycles, 10-year yields and the federal funds rate have converged near market peaks
Source: Bloomberg. Effective Federal Funds Rate, (FEDL01 Index) and 10-Year Treasury Constant Maturity Rate, Percent, Monthly, Not Seasonally Adjusted (USGG10YR Index). Data as of 10:36 a.m. ET 5/12/2022. Past performance is no guarantee of future results.
3. Credit spreads: Credit spreads have begun to rise, especially for the riskiest bond issuers. However, the rise has only brought spreads back to longer-term average levels. They aren’t yet at levels that suggest a significant rise in defaults among companies borrowing in the corporate bond market. However, the steepness of the rise in interest costs will likely weigh on the credit quality of the weakest issuers, like those in the HY market. HY spreads have historically risen most sharply later in an economic cycle, but we are watching the trend for signs that rising rates are slowing economic activity.
High-yield spreads have risen sharply
Source: Bloomberg, using daily data as of 10:38 ET 5/12/2022. Bloomberg U.S. Corporate High-Yield Bond Index (LF98TRUU Index). OAS is a method used in calculating the relative value of a fixed income security containing an embedded option, such as a borrower's option to prepay a loan.
4. The dollar: The U.S. dollar has risen also sharply in recent months, reflecting the relative strength of the U.S. economy compared to other major countries, widening interest rate differentials, and a degree of safe-haven buying as a result of global political turmoil.
Bloomberg U.S. Dollar Index remains firm
Source: Bloomberg. Bloomberg Dollar Spot Index (BBDXY Index). Daily data as of 10:41 a.m. ET 5/12/2022. Past performance is no guarantee of future results.
A strong dollar tends to be helpful in holding down domestic inflation, but because many globally traded goods are priced in U.S. dollars, it can contribute to inflation abroad as the purchasing power of other countries falls. Emerging-market (EM) countries, which require U.S. dollar reserves, tend to see the most negative impact on inflation and growth.
The recent surge in the dollar may be reaching a level where it is destabilizing for some EM countries with large amounts of U.S. dollar-denominated debt. The Fed doesn’t explicitly target a level for the dollar, but it does take the impact on the economy into consideration. If the dollar continues higher, it may lead the Fed to dial back its rate-hike plans.
What investors can consider now
There is a risk that yields rebound near-term until there are clear signs that inflation pressures are beginning to ebb in response to tightening monetary policy by major central banks. The Fed has indicated that its estimate of the neutral rate is around 2.0% to 2.5% but hasn’t ruled out exceeding that level if inflation doesn’t ease.
While we believe that it is likely that the worst of the jump in yields is behind us, calling a cyclical peak is difficult due to the myriad forces driving the markets. As a result, we’re monitoring the factors mentioned above. In the meantime, we suggest investors consider gradually adding some duration to portfolios with high-credit-quality bonds, such as Treasuries and investment-grade municipal and corporate bonds. Income-oriented investors can find yields that are now back at pre-pandemic levels, sometimes in bonds trading below par. That can offer the opportunity to invest for both income and potential total return.
1 "Nominal yield" refers to the interest rate (or "coupon rate") that a bond issuer promises to pay bond purchasers. The "real yield" is the nominal yield adjusted to remove the effects of inflation and reflects the real cost of funds to the borrower.
What You Can Do Next
Follow Kathy Jones (@KathyJones) on Twitter.
Talk to us about the services that are right for you. Call a Schwab Fixed Income Specialist at 877-566-7982, visit a branch, find a consultant or open an account online.
Explore Schwab’s views on additional fixed income topics in Bond Insights.
 By
By
