The Fed’s Next Move: Ukraine Changes the Picture

There’s an old Scottish saying that “the best-laid plans of mice and men often go awry.” That phrase probably captures the thinking of many members of the Federal Reserve these days.
After months of laying the groundwork for a steady and substantial tightening in monetary policy over the next year, the Federal Reserve now faces a sudden change in the economic outlook. Six months ago, the focus was on the economy’s strong rebound from the pandemic and tightening labor market. It seemed clear that the Fed would need to tighten policy quickly to bring down inflation.
Today, the picture is far more complicated. The outbreak of war in Ukraine and subsequent economic sanctions on Russia have caused a surge in commodity prices, due to the prospects of reduced supplies flowing to the markets. The result has seen inflation rise to its highest levels in over 40 years.
However, while these supply-side shocks are exacerbating already high inflation, they also can slow growth down the road. Moreover, this crisis is global in scale, and involves intense efforts to cut Russia’s access to the global financial system, which could put stress on Europe’s financial system. The unknown consequences of these factors make the actions of the U.S. central bank important to the international economy as well as the U.S. economy.
Given all these uncertainties, expectations about the path of Fed policy have swung wildly in the past few weeks. Two-year Treasury note yields, which largely reflect expectations about the path of the federal funds rate over the next few years, have traded in a huge 35-basis-point range since the outbreak of the Ukraine war.
Price and supply shocks
Past price shocks have tended to produce two outcomes: higher inflation and slower growth. The U.S. economy has suffered through oil price shocks in the past—especially during the 1970s oil embargoes. The result was a period of “stagflation” and recessions. More recently, oil prices have seen periods of large increases in the mid-2000s without necessarily triggering recessions. Today, the U.S. economy is less sensitive to rising energy costs than in the past due to the rise in domestic production, shift to other fuel sources, and increasing efficiency in energy usage.
Nonetheless, surging energy costs can slow economic growth by acting as a tax on consumer incomes, reducing business investment, and eroding consumer confidence and spending. Estimates of the impact to gross domestic product (GDP) vary from a reduction of 0.2% to as much as 1.0% over the next 12 months. Fortunately, the U.S. economy has been growing at a strong pace, which should help soften the blow to economic growth from higher energy costs. But it also is exacerbating an upturn in inflation spurred by supply shortages coming out of the pandemic and strong consumer demand.
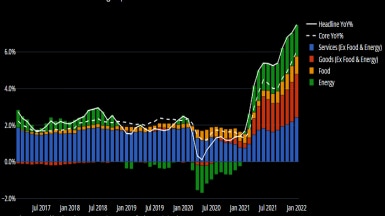
The impact on inflation is much easier to see since energy prices feed directly into calculations of CPI. As of the February report, surging energy costs have accounted for about a third of the increase in overall inflation.
Rising energy prices have contributed significantly to overall Consumer Price Index growth
Chart shows U.S. Consumer Price Index (CPI) topline contributions and core CPI, year-over-year percent change.
Source: Bloomberg. Monthly data as of 1/31/2022.
Longer-term outlook
In recent congressional testimony, Federal Reserve Chair Jerome Powell indicated that the central bank still planned to raise short-term interest rates by 25 basis points at its March 15-16 meeting. However, we believe there is a good chance that this will be a slower and shallower rate-hike cycle than previously anticipated, due to the potential for slower economic growth, easing inflation later in the year, and tightening financial conditions.
Despite the recent spike, we expect inflation to ease later in the year as comparisons to year-ago readings level out, waning fiscal stimulus slows the pace of consumer demand, and tighter monetary policy tightens lending conditions. There are already signs of a slowdown in housing activity due to rising mortgage rates and business inventories rising relative to new orders.
Mortgage applications have dropped
Source: Mortgage Bankers Association (MBA) mortgage applications (MAVCHNG Index). Data as of 2/25/2022.
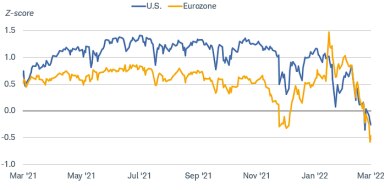
While the Fed’s policy setting is too easy for the current level of inflation and growth, financial conditions have tightened significantly in both the U.S and Europe in recent weeks, indicating rising level of financial stress. If credit spreads widen significantly and/or the dollar moves sharply higher, those would be signs that could make the Fed slow down its tightening.
Financial conditions in the U.S. and Europe are tightening rapidly
Source: Bloomberg. Bloomberg U.S. Financial Conditions Index and Bloomberg Eurozone Financial Conditions Index (BFCIUS Index, BFCIEU Index). Daily data as of 3/2/2022. The Z-Score indicates the number of standard deviations by which current financial conditions deviate from the average. A positive value indicates accommodative financial conditions, while a negative value indicates tighter financial conditions.
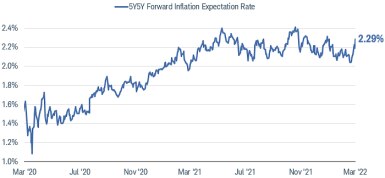
Lastly, long-run inflation expectations are relatively low compared to current inflation readings, signaling that the markets are not anticipating an inflationary spiral. The Fed watches this reading carefully, because inflation expectations are often thought to be self-fulfilling.
Long-run inflation expectations are relatively muted
Notes: A measure of the average expected inflation over the five-year period that begins five years from the date data are reported. The rates are composed of Generic United States Breakeven forward rates: nominal forward 5 years minus US inflation-linked bonds forward 5 years.
Source: Bloomberg 5-year 5-year Forward Inflation Expectation Rate (USGG5Y5Y Index). Daily data as of 3/2/2022.
In sum, although the folks at the Fed would like to pursue a steady path to raising short-term interest rates and reducing its balance sheet, it may not be as easy as they might have expected just a few weeks ago. We think it’s likely that the Fed will move cautiously in the months ahead, with four to five rate hikes this year.
The Fed’s large balance sheet gives it a lot of flexibility to adjust financial conditions as needed. To date, it hasn’t laid out a plan. All else being equal, the Fed would probably begin to reduce its bond holdings in the second quarter with an eye to drawing it down by about $500 billion this year and potentially another $1 trillion in 2023.1 But the process can stop and start as the Fed sees fit, so it may become a more active tool of policy. Since the Fed has performed the role of lender of last resort in times when markets seize up, it will need to be sure it’s providing ample liquidity to global markets.
What investors can do
We would continue to be cautious about taking on significantly more risk in this environment. Markets are not only subject to rapid changes in the economic and policy outlook, but also shifting political decisions. Liquidity conditions in markets are also subject to sudden changes, which can make it challenging to enter or exit positions at reasonable prices.
That said, volatility can create opportunities. For investors looking for opportunities, we suggest being sure that the size of those investments is in proportion to risk budget, rather than coming out of core positions. For reference, the historical performance of different assets classes during periods of high and low inflation are shown in the chart below.
Returns in high- and low-inflation periods
Source: Bloomberg & Morningstar. S&P GSCI Index, Gold Dollar Spot, ICE BofA U.S. Mortgage Backed Securities Index, Ibbotson Associates SBBI U.S. Large Stock TR, Ibbotson Associates SBBI U.S. 1-Month Treasury Bills, Bloomberg Barclays U.S. Aggregate Corporate Bond Index, MSCI EAFE Net Total Return USD Index, ICE BofA U.S. Municipal Securities Index, Bloomberg Barclays U.S. Corporate High Yield Bond Index, U.S. Treasury Inflation Protected Securities, Ibbotson Associates SBBI U.S. Intermediate-Term Government TR, and Ibbotson Associates SBBI U.S. Long-Term Government TR (SPGSCITR Index, XAU Currency Index, MA0A Index, LUACTRUU Index, NDDUEAFE Index, U0A0 Index, LF98TRUU Index, LBUTRUU Index). Monthly data from January 1960 to December 2021. Past performance is no guarantee of future results.
For fixed income investors, we continue to suggest keeping average portfolio duration low, but to look for times when 10-year Treasury yields move above 2% to add a modest amount of duration. While Treasury Inflation-Protected Securities (TIPS) are considered an inflation hedge, TIPS’ current pricing makes them relatively expensive compared to our expectations. A core allocation to TIPS is still appropriate for times when inflation surges.
Despite the uncertainties in the outlook for the economy and Fed policy, we believe investors should continue to hew to their “best-laid plans.” Those with a long-term strategy that suits their risk tolerance and capacity should stick with their plans.
1 The Hutchins Center on Fiscal and Monetary Policy (Brookings Institution)
What You Can Do Next
Follow Kathy Jones (@KathyJones) on Twitter.
Talk to us about the services that are right for you. Call a Schwab Fixed Income Specialist at 877-566-7982, visit a branch, find a consultant or open an account online.
Explore Schwab’s views on additional fixed income topics in Bond Insights.
 By
By
