The Fed’s Policy Tightening Plan: A One-Two Punch
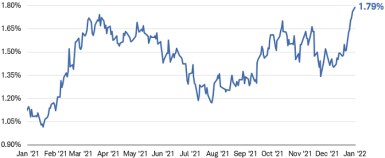
The Federal Reserve dealt the bond market a sharp body blow on January 5th with the release of the minutes of its last Federal Open Market Committee (FOMC) policy meeting in December 2021. The Fed already had signaled it likely would hike short-term rates, perhaps starting as early as March. However, the big surprise was that the minutes also indicated that the Fed was considering quantitative tightening—shrinking its balance sheet. FOMC members Mary Daly, Christopher Waller, and James Bullard reinforced the message that the Fed was considering using the balance sheet to tighten policy along with rate hikes. The bond market reeled, with 10-year Treasury yields hitting 1.80% on an intra-day basis—the highest level in two years—before closing at 1.79%.
The 10-year Treasury yield rose to the highest level all year
Source: Bloomberg. U.S. Generic 10-year Treasury Yield (USGG10YR INDEX). Daily data as of 1/10/2022.
The Fed’s one-two-punch strategy caught the market by surprise. Few anticipated that quantitative tightening would start so soon after rate hikes. It’s a sharp departure from Fed policies in the period following the 2007-2009 financial crisis, when the Fed waited two years after hiking rates in December 2015 to end its quantitative-easing program. With quantitative easing, or QE, the Fed buys securities—such as Treasuries and mortgage-backed securities—in order to add cash (or “liquidity”) to financial markets.
When the Fed did initiate quantitative tightening in 2017, it was a slow process. It stopped reinvesting the principal and interest on maturing bonds but capped the amount that it allowed to “roll off” the balance sheet at any time, to mitigate the impact on interest rates and the economy. This cautious approach to tightening reflected the sluggish pace of the economic recovery at the time. Job and wage growth were slow, and inflation was low.
Moreover, the process was complicated by a tightening in financial conditions from 2012 to 2016 due to a strong rise in the dollar. Consequently, it took two years for the Fed’s balance sheet to decline from $4.2 trillion to $3.6 trillion. At that point, the balance sheet still stood at 17.8% of gross domestic product (GDP), compared to the pre-financial-crisis level of about 6% of GDP. Since then, the Fed’s balance sheet has soared to more than $8 trillion, or 38% of GDP.
The Fed’s balance sheet has ballooned to over $8 trillion
Source: Bloomberg. Reserve Balance Wednesday Close for Treasury Bills, Treasury Notes, Treasury Bonds, Treasury Inflation Protected Securities (TIPS), and Mortgage-Backed Securities (MBS). Weekly data as of 1/5/2022.
The Fed’s current approach reflects the starkly different economic backdrop today compared to the years after the 2007-2009 financial crisis. Economic growth is booming, a tight labor market is pushing up wages, and inflation has spiked to its highest level in decades. Real interest rates—adjusted for inflation expectations—have been steeply negative for the past few years, contributing to very loose financial conditions. This heightens the risk that an overheating economy will push inflation even higher.
Chicago Fed National Financial Conditions Index shows easy conditions
Notes: The Chicago Fed’s National Financial Conditions Index (NFCI) provides a comprehensive weekly update on U.S. financial conditions in money markets, debt and equity markets and the traditional and “shadow” banking systems. Positive values of the NFCI indicate financial conditions that are tighter than average, while negative values indicate easier-than-average financial conditions. This figure plots the NFCI, along with contributions to the index from the three categories of financial indicators (risk, credit, and leverage). The contributions sum to the overall index.
Source: Federal Reserve Bank of Chicago. Chicago Fed National Financial Conditions Index, Index, Monthly, Not Seasonally Adjusted. Monthly data as of 12/31/2021.
What to watch now
1. Communications: Given the strong market reaction to the prospect of tighter policy, it’s likely that the Fed will use its “communication tool” to calm markets. By clarifying its plans, the Fed can help reduce some of the potential volatility as markets adjust to its shift in policy.
2. Rate hikes followed by quantitative tightening: Based on the recent indications from the Fed, we expect to see the federal funds rate increased three times this year, starting in March. If growth remains strong and inflation high, then the Fed will likely begin to allow bonds to mature off its balance sheet, as early as the second half of the year. Any limits on the amount of bonds allowed to roll off the balance sheet are likely to be higher than in the 2017-2019 period, when the combined caps for Treasuries and MBS started at $10 billion per month and gradually rose to $30 billion per month over a year’s time.
By allowing a faster roll-off using higher caps, the balance sheet can shrink quickly, because a large chunk of the Fed’s Treasury holdings mature in the next few years. Moreover, there are $4 trillion in reserve balances that likely will be withdrawn quickly as short-term rates rise. (Higher short-term interest rates will likely attract more money into money market funds, reducing the amount that banks hold at the Fed).
The Fed's balance sheet shows a significant proportion of its Treasuries will mature in the next few years, even though it has a weighted average maturity of 9.8 years
Source: Bloomberg. Federal Reserve SOMA Maturity Distribution. Data as of 12/31/2021.
The Fed also has the option to sell bonds from its balance sheet outright if long-term interest rates begin to fall. Typically, in time periods when the Fed is hiking short-term interest rates, the yield curve flattens. Long-term rates tend to rise less than short-term rates, or even decline because tighter monetary policy signals slower growth and lower inflation down the road. Over the past year, the yield initially steepened as long-term yields surged, but then flattened as short-term yields have caught up. The spread between two-year and 10-year Treasury yields is roughly 90 basis points, compared to 80 basis points at the start of 2021 (one basis point is equal to 1/100th of one percent, or 0.01%).
The yield curve has been in a flattening trend over the past year
Note: The rates are comprised of Market Matrix U.S. Generic spread rates (USYC2Y10). This spread is a calculated Bloomberg yield spread that replicates selling the current 2-year U.S. Treasury Note and buying the current 10-year U.S. Treasury Note, then factoring the differences by 100. Past performance is no guarantee of future results.
Source: Bloomberg. Daily data as of 1/10/2022.
3. Yield curve signals: A rapid pace of short-term rate hikes could risk a yield curve inversion—which is a signal that financial conditions have tightened too much and could lead to a recession. To avoid that outcome, the Fed could sell some of its long-term Treasuries or mortgage-backed securities. The rationale for selling MBS is that the housing market is very strong and therefore doesn’t need the Fed’s support. However, if the yield curve flattens significantly or inverts due to dimming prospects for growth and inflation, then the Fed always has the option to halt any tightening.
What investors can do
The prospect of a two-stage policy tightening by the Fed raises the risk that yields will continue to rise, especially in the early months of the year. We expect volatility to be high as the markets try to assess a potentially uneven path of Fed policy. Aggressive tightening by the Fed could mean that the economy slows and inflation peaks early in the year.
For now, we continue to favor keeping average portfolio duration low, but investors who take a buy-and-hold approach could begin to add a small allocation to longer-term bonds gradually as 10-year Treasury yields rise above 1.75%. Using bond ladders or barbells to help minimize exposure to interest rate fluctuations can make sense. We would be cautious about the riskier segments of the market, such as high-yield bonds, which could be more volatile during a period of falling market liquidity. Overall, a broadly diversified portfolio of high-credit-quality bonds that matches your risk tolerance and capacity should allow you to “roll with the punches” in 2022.
What You Can Do Next
Follow Kathy Jones (@KathyJones) on Twitter.
Talk to us about the services that are right for you. Call a Schwab Fixed Income Specialist at 877-566-7982, visit a branch, find a consultant or open an account online.
Explore Schwab’s views on additional fixed income topics in Bond Insights.
 By
By
