Global Outlook: Recovery and Risk

A better year for investors may lie ahead, but volatility may remain high in early 2023 as a potential global recession lingers, central banks step down rate hikes and China's reopening introduces upside risk to inflation. We believe that investors can continue to focus on stocks with "quality" characteristics that outperformed in the up-and-down markets of 2022 and contributed to international stock market outperformance last year.
Stepping down
Markets seem to have been taking their direction from central banks during 2022 and we anticipate that probably will continue in the quarters to come. While a pivot to rate cuts does not seem likely in the near term, central banks seem to be signaling a step-down in the size of the rate hikes, and in some cases, even a pause. The stock market has offered Thanksgiving in return with an early "Santa Pause" rally; the MSCI World Index of global stocks is up over 15% since the end of September, the strongest gain for a quarter since the pandemic rebound in the second quarter of 2020.
- The U.S. Federal Reserve has signaled a slowdown in the pace of rate hikes from 75 basis points (bps) in November to 50 bps in December.
- The Bank of Canada stepped down from 75 bps to 50 bps in late October.
- The central banks of Australia and Norway stepped down from 50 bps to 25 bps at their meetings in October/November.
- The central bank of one of the largest emerging market economies, Brazil, and the central bank for the largest emerging market economy in Europe, Poland, both paused, leaving rates unchanged.
All of these central banks meet again to set rates during the next two weeks.
The chart below shows the pace of rate hikes for major central banks—notice that the bars are getting smaller as rate hikes moderate. The shaded column for December reflects current market-based forecasts for the upcoming rate-setting meetings and blank columns reflect months without scheduled central bank rate-setting meetings (see Central Banks Stepping Down for more on our thoughts on the end of rate hikes).
Rate hikes getting smaller in size

Source: Charles Schwab, Bloomberg, as of 12/2/2022.
*The market-based forecasts contained herein are for illustrative purposes only, may be based upon proprietary research and are developed through analysis of historical public data. Blank columns reflect months without scheduled central bank rate setting meetings.
Global recession?
Inflation is still stubbornly high. Central banks stepping down the pace of rates hikes is more about responding to weak economies than making strong progress on lowering inflation. Even though third-quarter economic growth was better than expected for many major countries in North America, Europe, and Asia, a global recession likely began sometime during the third quarter.
One important signal of an already-underway recession is the leading indicator for the world economy produced by the Organization for Economic Cooperation and Development (OECD). In this index, a drop below 99 tends to happen right around the start of a global recession: in early 2020, early 2008, early 2001, late 1990, late 1981, mid-1974, and mid-1970. We even saw this indicator give a double-dip below 99 before recovering after the recessions in the early 1990s and early 2000s, as you can see in the chart below. It's a repeating story, and it's below 99 again, signaling another potential recessionary period.
Global leading indicators point to global recession

Source: Charles Schwab, Organization for Economic Cooperation and Development, Bloomberg data as of 12/2/2022.
Another important indicator, the global Purchasing Manager's Index (PMI) is also signaling a possible recession having slipped below 50—the threshold between expansion and contraction—during the third quarter. The global composite PMI is compiled from surveys of business leaders for around 27,000 companies in over 40 countries accounting for 89% of global GDP.
Global PMI slipped into recession territory in Q3

Source: Charles Schwab, S&P Global, Bloomberg data as of 12/2/2022.
The depth of this potential recession appears to be mild, so far. Some parts of the global economy and some countries are growing, offsetting others that are contracting. For example, while there remains strength in services (seen in travel and leisure), the demand and manufacture of goods has been weakening (evidenced by rising inventories and slowing product sales). The likely recession is rolling through different parts of the global economy at different times, in contrast to the everything-everywhere-all-at-once recessions of 2020 and 2008-9.
Big risk for 2023
China's authorities are preparing to reopen and end the zero-COVID policies that have held back their economy for the past three years. In reaction, the MSCI China Index was up 29% in November, compared to just 5% for the S&P 500 Index. This surge in Chinese stocks has propelled outperformance of emerging market stocks. Yet, the potential reopening poses upside risk to inflation, just as central banks appear to be stepping down their rate hikes.

Despite the fact that China has started to shift away from its zero-COVID protocols, we think a full reopening is unlikely before the end of winter (when respiratory infections typically rise). Current COVID cases have already climbed to new highs, according to China's National Health Commission. Additionally, the geographic spread of the virus is the widest it has ever been, with 203 cities reporting outbreaks in November (for more of our thoughts on the impacts and timing of China's reopening see: Risk for 2023: China Reopening).
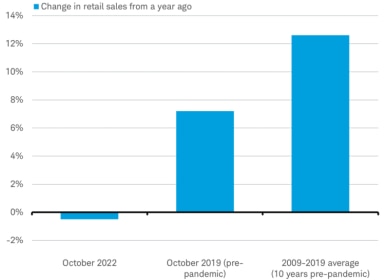
China's reopening may be like most other countries' reopening experiences, with economic growth accelerating (especially household consumption) and inflation picking up. Any surge in demand from reopening may not be balanced by a similar surge in supply. While China's authorities allowed demand to slump under the zero-COVID policy, they went to great lengths to prevent disruption to production and supply chains. Any reopening beginning in March or April is likely to be gradual but could lead to a surge in pent-up spending of 1.4 billion consumers; the world's second-largest economy could lead to a rebound in global inflation for both commodities and goods. The timing is not ideal, as it may come at just the point when central banks were planning on pausing their rate hikes.
Pent-up consumer demand?
Source: Charles Schwab, National Bureau of Statistics for China, Bloomberg data as of 11/17/2022.
As China moves toward reopening in 2023, we will be watching developments carefully to assess the balance between the impact of reopening excitement and inflation worries on the stock market.
Investing in 2023
The stock market has moved more than 5% up or down in each of the past six months (up more than 5% in July, October, and November and down more than -5% in June, August, and September). Volatility may remain high in the coming months as a potential global recession lingers, central banks step down rate hikes and China's reopening introduces upside risk to inflation. Efforts to rotate among groups of stocks to try to insulate from elevated volatility or try to time a recovery may be unnecessary. We believe that investors can simply stick with what has been working in 2022. For the past year we have been highlighting characteristics of stocks that are outperforming, focusing on quality stocks, which we have defined in different ways.
One way we've been defining quality stocks is high-dividend payers—generally a sizeable dividend is a sign of financial strength and good cash flow. High-dividend-paying stocks have outperformed during past recessionary bear markets and are outperforming again this year across sectors and countries. The MSCI World High Dividend Index suffered a loss in total return of -2.6% so far in 2022—nearly flat and much better than the -14.1% loss for the overall stock market. More importantly, high-dividend stocks outperformed both when the market was going down during the first three quarters of the year and when it was rising during the fourth-quarter rally. There can be no guarantees, but investors may be able to navigate 2023 by sticking with what has been working in both up and down markets during 2022.
High-dividend-paying stocks outperforming overall market by wide margin

Source: Charles Schwab, Bloomberg data as of 12/1/2022.
Indexes are unmanaged, do not incur management fees, costs and expenses, and cannot be invested in directly. Past performance is no guarantee of future results.
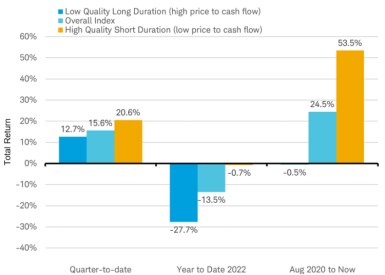
Another way we have been defining quality stocks is focusing on stocks with more immediate cash flows, rather than cash flows in the distant future: short duration stocks. These stocks have outperformed since rates bottomed in 2020. They also outperformed in 2022 when the market was falling and in the fourth quarter when it rebounded. The easiest way to find them? Use the price-to-free-cash-flow ratio to sort stocks: the lower the price to free cash flow, the higher the quality.
Short duration stocks outperforming long duration stocks
Source: Charles Schwab, FactSet data as of 12/2/2022. Universe of stocks for quality/duration screen is MSCI World Index. Past performance is no guarantee of future results.
Since signs of a stepping-down began to emerge at the start of October, the MSCI EAFE Index of international stocks climbed 20% and is now slightly outperforming the S&P 500 on a year-to-date basis, despite this year's big gain in the U.S. dollar. The outperformance by international stocks may continue in 2023. International stocks tend to possess more of the characteristics, like high dividend yields and lower price-to-cash-flow ratios, that have contributed to outperformance within and across sectors and countries this year. Earnings growth is also stronger outside the United States and is expected by analysts to remain so in 2023. The year-over-year earnings growth for S&P 500 companies in the recently reported third quarter was 4.1%, compared to 30.5% for companies in Europe's STOXX 600 Index. Combined with lower valuations, this has helped international stocks outperform, which may become more pronounced with a pause or reversal in the sharp rise of the dollar that characterized much of 2022.
Michelle Gibley, CFA®, Director of International Research, and Heather O'Leary, Senior Global Investment Research Analyst, contributed to this report.
 By
By

