Home Is Where the Inflation Is

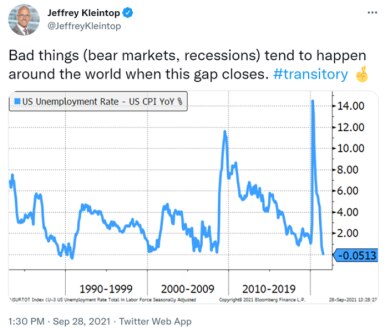
A year ago, we highlighted a worrisome indicator of potential recession and bear markets, referenced in the below tweet from September 28, 2021. When the line falls to zero as the inflation rate rises to converge with a falling unemployment rate, it has historically marked the start of a recession, as we saw in the U.S. during 1990-91, 2001, 2008-09, and 2020. This phenomenon suggests an overheating economy in which supply is not able to keep up with demand. Unfortunately, this indicator still isn't showing improvement one year later, implying continued pressure on the economy and markets.
This indicator has worsened dramatically this year, as you can see in the chart below. The line tracking the unemployment rate minus the rate of inflation didn't merely fall to zero, as it had done in the prior four recessions. Instead, it plunged deeply negative as inflation soared and unemployment reached 50-year lows. We have seen this indicator continue to worsen elsewhere in the world, including the United Kingdom, Japan, Germany and Australia.
Recession Indicator - United States
Inflation measured by Consumer Price Index year-over-year % change.
Source: Charles Schwab, Bloomberg data as of 9/11/2022.
In the United Kingdom, this gap either closed or narrowed to less than two percentage points ahead of prior recessions, as you can see in the chart below. It now stands at -5.6%.
Recession Indicator - United Kingdom
Inflation measured by Consumer Price Index year-over-year % change.
Source: Charles Schwab, Bloomberg data as of 9/11/2022.
In Japan, the gap between inflation and the unemployment rate narrowed sharply ahead of prior recessions even if it didn't always completely close, as you can see in the chart below. Today, it has completely closed.
Recession Indicator - Japan
Inflation measured by Consumer Price Index year-over-year % change.
Source: Charles Schwab, Bloomberg data as of 9/11/2022.
In Germany, the gap between the unemployment rate and the inflation rate is best measured using the Producer Price Index (PPI) rather than the Consumer Price Index (CPI). Germany traditionally has the largest trade surplus of any country in the world, with nearly half of the country's GDP coming from the production of exports, making producer inflation more representative of an economic indicator.
Recession Indicator - Germany
Inflation measured by Producer Price Index year-over-year % change.
Source: Charles Schwab, Bloomberg data as of 9/11/2022.
Although Australia did not technically have a recession for about 30 years after 1990-91, due in part to the growth of nearby China, GDP did fall by about half of one percentage point during a quarter in both 2000 and 2008. We shaded those a different color in the chart below to note these significant periods of weakness for both the Australian economy and stock market that were signaled by the closing gap between the unemployment rate and inflation rate.
Recession Indicator - Australia
Inflation measured by Consumer Price Index year-over-year % change.
Source: Charles Schwab, Bloomberg data as of 9/11/2022.
Monumental moves
Inflation surging above the unemployment rate has prompted major central banks to respond and hike rates by 75 basis points (bps) in September, including the Bank of Canada, European Central Bank (ECB) and, very likely, the U.S. Federal Reserve and Bank of England next week. These are monumental rate hikes, compared to the more typical 25bp adjustments seen in the past three decades. For example, the last time the ECB or its predecessor, the German Bundesbank, hiked rates by 75 bps was 30 years ago in August 1992, after the fall of the Berlin Wall. With the unification of West and East Germany, the central bank had to manage tremendous economic upheaval including inflation. In August 1992, inflation in Germany was 5%, it's now 8%.
50 years of European policy interest rates
Source: Charles Schwab, Macrobond, Bundesbank, European Central Bank as of 9/8/2022
Inflation breakdown
For most countries, the excess inflation is currently concentrated in housing and food—as we can see in the chart breaking down the components of inflation for Germany.
Germany: inflation components
Source: Charles Schwab, Macrobond, Regional German statistical offices data as of 9/9/2022.
While agricultural commodity prices have shown recent signs of easing, housing has continued to climb and is the largest component of overall inflation.
Housing costs
Examining housing costs helps to estimate when overall inflation may begin to ease more significantly and subsequently allow central banks to end their series of substantial rate hikes that are pressuring the economy and markets.
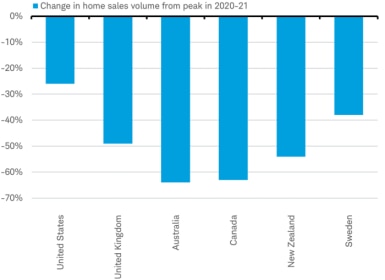
Following the rapid deterioration in affordability driven by higher interest rates, home sales are falling quickly from record levels in major countries. Home sales are now below the pandemic peak by more than 60% in Australia and Canada, 50% in the United Kingdom and New Zealand, 40% in Sweden, and 20% in the United States. Home prices are also easing.
Home sales have plunged as affordability has worsened
Source: Charles Schwab, Macrobond, U.S. National Association of Realtors, UK HM Revenue & Customs, Australia Housing Industry Association, Toronto Real Estate Board (Canada), Real Estate Institute of New Zealand, Svensk Mäklarstatistik (Sweden), latest available data as of 9/11/2022.
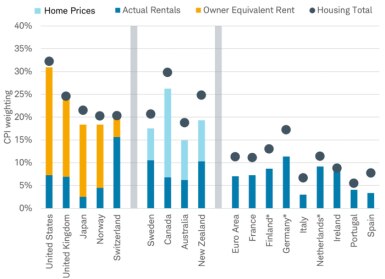
Although home prices have started to ease, the flow through to housing inflation in the consumer price index isn't that straightforward. Housing inflation is not dramatically impacted by changes in home prices. Only Canada, New Zealand, Sweden, and Australia include home price data in housing inflation. In contrast, the inflation measures for Europe include only data on rental rates and those in the U.S., U.K., Japan, Norway, and Switzerland rely primarily on an estimate of what the owner's house might rent for.
Breakdown of CPI for housing by country
* Finland has plans to implement home prices into its CPI calculation. Germany and the Netherlands are expected to implement owner equivalent rent into their CPI calculation by 2023. Grey bars delineate grouping boundaries. Source: Charles Schwab, various governmental sources, data as of 9/10/22.
What does it all mean?
The takeaway for investors from this technical detail on the measurement of housing inflation is that the CPI will likely ease significantly where housing inflation is based on home prices—as it is in Australia, Canada, New Zealand, and Sweden. In contrast, countries where shelter inflation is based on rental prices, as it is in the U.S. and Europe, may see upward housing inflation in CPI figures, as declining housing affordability shifts demand away from purchases to rentals, which may lift rental inflation.
The indicator of recession may ease more quickly in those countries that measure CPI using home prices, which may allow central banks in these countries to respond to easing inflation with an end to rate hikes. By contrast, persistently high inflation may mean central banks in the U.S. and Europe may continue to pursue aggressive rate hikes even as home prices ease.
Michelle Gibley, CFA®, Director of International Research, and Heather O'Leary, Senior Global Investment Research Analyst, contributed to this report.
 By
By

![Line chart illustrating U.S. unemployment rate less U.S. inflation rate measured by CPI year over year change from 1982 through present.]](/sites/g/files/eyrktu871/files/styles/embedded_385/public/figure2_47.png?itok=TwxnKZC_)
![Line chart illustrating U.K. unemployment rate less U.K. inflation rate measured by CPI year over year change from 1988 through present.]](/sites/g/files/eyrktu871/files/styles/embedded_385/public/figure3_45.png?itok=ZAUWQsoe)
![Line chart illustrating Japan unemployment rate less Japan inflation rate measured by CPI year over year change from 1992 through present.]](/sites/g/files/eyrktu871/files/styles/embedded_385/public/figure4_35.png?itok=5rot_LKc)
![Line chart illustrating German unemployment rate less German inflation rate measured by PPI year over year change from 2004 through present.]](/sites/g/files/eyrktu871/files/styles/embedded_385/public/figure5_24.png?itok=ylev-xun)
![Line chart illustrating Australian unemployment rate less Australian inflation rate measured by CPI year over year change from 1988 through present.]](/sites/g/files/eyrktu871/files/styles/embedded_385/public/Figure6_1.png?itok=lTiZtNvg)
![Line chart showing history of European policy interest rates since 1970.]](/sites/g/files/eyrktu871/files/styles/embedded_385/public/Figure7.png?itok=CYkhU5Bg)
![Bar graph illustrating the components of German inflation: housing, food, recreation, transportation, and other from mid-2017 through present.]](/sites/g/files/eyrktu871/files/styles/embedded_385/public/figure8_4.png?itok=Y9Pw_dFx)

