Opportunities Come Knocking in the Muni Market

Ouch.
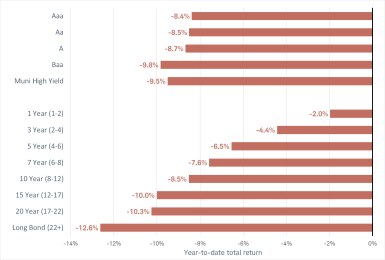
If you were to summarize the start of the year for municipal bonds in one word it would be that—ouch. This has been the worst start to a year in roughly three decades, but the good news is the sharp selloff has finally created some opportunities that haven't existed in years.
Returns for all major muni categories are down for the year
Source: Components of the Bloomberg Municipal Bond Index, as of 4/27/22. Past performance is no guarantee of future results. Indexes are unmanaged, do not incur management fees, costs and expenses and cannot be invested in directly.
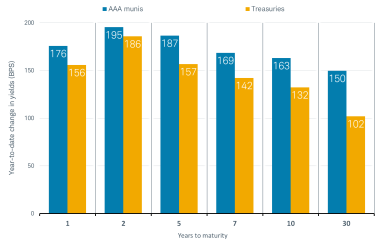
Surging Treasury yields drove the sharp decline in prices, because bond prices and yields move in opposite directions. Inflation is at multi-decade highs and the pivot by the Federal Reserve to aggressively hike rates sent the 10-year Treasury yield up more than 130 basis points since the end of 2021 (one basis point equals 0.01%). Short-term yields are up even more, with the two-year Treasury rising over 190 basis points.
Yields are up significantly since the start of the year
Source: Bloomberg, as of 4/27/22. AAA munis are represented by the Bloomberg BVAL Curve and Treasuries are represented by the US Treasury Actives Curve. Past performance is no guarantee of future results.
For income-oriented investors, the rise in yields is welcome because over the past decade, yields have rarely been as high as they are now.
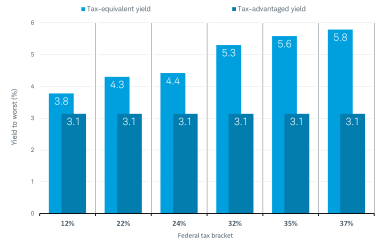
Municipal bonds are generally not subject to federal and potentially state income taxes, and therefore usually pay lower yields than comparable, taxed bonds. One common method to adjust for this difference is to look at the “tax-equivalent yield,” or the pre-tax yield a bond would need to be equal to the yield of a tax-advantaged bond.
As illustrated in the chart below, the yield to worst for a broad muni index is over 3%. This compares to a tax-equivalent yield of 5.8% for an investor in the top tax brackets. In other words, a fully taxable bond that yields 5.6% would yield the same as a municipal bond that yields 3% for an investor in the top tax bracket.
The tax-equivalent yield for munis is above 5.6% for investors in the top tax bracket
Source: Bloomberg Municipal Bond Index, as of 4/27/22. Assumes a 5% state tax rate for all brackets and a 3.8% ACA tax for the 32% and above brackets. Past performance is no guarantee of future results. Indexes are unmanaged, do not incur management fees, costs and expenses and cannot be invested in directly.
Munis may yield more than Treasuries after taxes
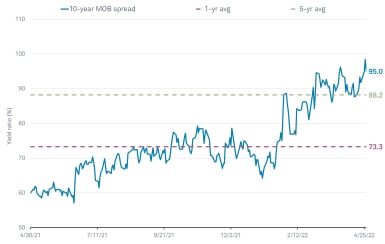
Relative to other fixed income investments, muni yields are attractive, too. One common metric to analyze the relative attractiveness of the muni market is the municipals over bonds (MOB) spread. It's a ratio of the yield on a AAA muni to that of a Treasury before considering the tax benefits that munis offer. Since the start of the year, the MOB spreads for most maturities have been steadily climbing and are now above their five-year averages.
Valuations have improved steadily throughout the year
Source: Bloomberg, as of 4/27/22. BVAL AAA Muni Yield as a % of Treasury 10 Year (MUNSMT10 Index). Past performance is no guarantee of future results.
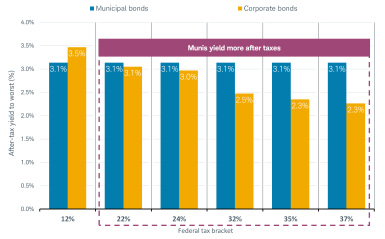
Munis are attractive relative to corporate bonds, too
Throughout most of 2021 and the early part of 2022, a muni investor needed to be in the very top tax brackets for munis to yield more than corporate bonds of similar maturities after taxes. With the recent rise in yields, that's no longer the case. An investor in the 22% tax bracket can now achieve a higher after-tax yield with munis compared to corporate bonds.
Munis yield more than corporates for investors in the 24%-and-above tax brackets
Source: Bloomberg Municipal Bond and Bloomberg Corporate Bond Index. As of 4/27/22. The difference in yields may be attributable to characteristics such as different credit qualities, durations, or other features. Corporate bonds assume an additional 5% state income tax and 3.8% ACA tax for the 32% and above tax brackets. Past performance is no guarantee of future results. Indexes are unmanaged, do not incur management fees, costs and expenses and cannot be invested in directly.
The risk of widespread muni defaults is low, in our view
Although prices have fallen, it's largely due to rising interest rates and not credit concerns. As a result, we believe the risk of defaults in the muni market remains low.
The ongoing economic recovery, combined with the multiple rounds of federal aid, have helped bolster most state and local governments' finances. Tax revenues have surged and rainy day funds (a pool of money a state can use under certain circumstances) are also at record highs, according to the National Association of State Budget Officers. Generally, states have used rainy day funds to help counteract the negative impact of declining revenues.
In addition to surging revenues and stronger rainy-day balances, the risks posed by underfunded pension liabilities have declined. This is due to states and local governments increasing contributions and enacting reforms, in addition to strong stock market returns. Nationally, state pension funds are 80% funded, which is considered to be a fully funded plan. Funded ratios vary by state, however.
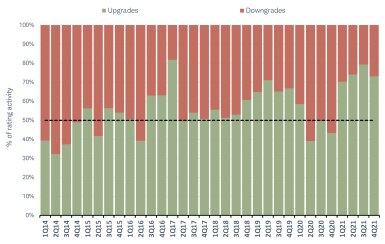
The ongoing improvement in credit conditions has boosted muni ratings. Over the past four quarters, Moody's has upgraded more muni issuers than they have downgraded. Even Illinois, New Jersey, and Connecticut—often considered three of the more financially troubled states—have received credit rating upgrades for their general obligation bonds.
Ratings upgrades have outpaced downgrades over the past four quarters
Source: Moody's Investors Services, as of 2/15/22. Based on number of ratings changes.
Consider extending duration
As painful as the recent move up in yields has been, we believe the worst is likely already behind us. At the start of the year, the market was anticipating the Fed would only increase the federal funds rate to slightly above 1%. That's now shifted to over 3% this year. Consequently, yields have jumped in anticipation of Fed tightening. We believe that a lot of the tightening is already being discounted by the market.
Because we believe the worst of the rise in yields is behind us, we suggest investors extend their duration. (Duration is a measure of how much a bond's price will change based on fluctuations in interest rates.) For reference, the Bloomberg Barclays Municipal Bond Index has a duration of 5.3 years.
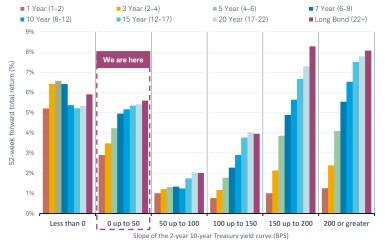
Moreover, the current shape of the yield curve signals that extending duration is attractive. The yield curve is a plot of yields relative to the years to maturity. We found that when the difference in yields between two- and 10-year Treasuries is between 0 and 50 basis points, longer-duration munis have historically performed well over the following 52 weeks, as illustrated in this chart. As of April 22, 2022, the 2/10s spread was roughly 23 basis points.
Longer-duration munis have historically performed well when the yield curve is flat
Source: Bloomberg and the components of the Bloomberg Municipal Bond Index using weekly data from 1/2/98 to 4/16/21. Past performance is no guarantee of future results. Indexes are unmanaged, do not incur management fees, costs and expenses and cannot be invested in directly.
The favorable economic backdrop supports selectively taking on some credit risk
Given the current favorable economic outlook, we suggest adding some lower-rated (A/A and Baa/BBB) issuers in moderation. In addition to the positive economic backdrop, valuations favor lower-rated munis relative to alternatives. For example, a generic five-year BBB rated muni yields roughly 3.4%, versus a comparable five-year BBB rated corporate bond that yields 3.9%. After considering the impact of taxes, an investor would only need an "all-in tax rate" of at least 14% for the corporate bond to yield the same as the municipal bonds. An "all-in tax rate" is a combination of federal, state, and other applicable taxes.
Risks to our view
A risk is Treasury yields continue to rise and munis follow suit, resulting in additional price declines. Another risk is the potential for a recession in the near term due to the Federal Reserve tightening policy too much. A slowdown in economic activity, combined with rising unemployment, would likely result in lower tax revenues for state and local governments. As a result, they would have less financial flexibility to meet debt service. A recession in the near-term is not our base case, but the risks are rising.
What to do now
Despite the rough start to the year, the move up in yields has created opportunities.
Investors who own mutual funds or ETFs and want to consider our guidance and add some lower credit quality munis should review the mutual fund or ETF's portfolio composition. This is on the "Holdings" page for the respective fund on Schwab.com. Look for funds that have a larger portion of their holdings in A/A and BBB/Baa rated munis relative to their benchmark.
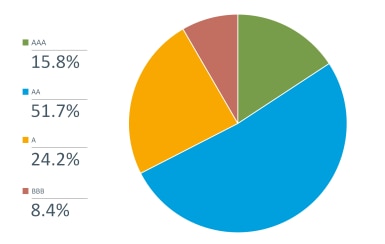
For reference, the chart below shows the ratings composition of the Bloomberg Municipal Bond Index. A word of warning: With BBB rated issuers, nearly half of the BBB portion of the index is made up of only 10 issuers, which can make liquidity or finding enough issuers for adequate diversification potential challenges for that segment of the market.
Ratings composition for the Bloomberg Municipal Bond Index
Source: Bloomberg Municipal Bond Index, as of 4/27/22. Indexes are unmanaged, do not incur management fees, costs and expenses and cannot be invested in directly. Note: does not add up to 100% exactly due to rounding.
Investors with larger portfolio balances may want to consider individual bonds or investing via a separately managed account (SMA).
For help selecting the solutions for your situation, consider reaching out to a Schwab representative.
 By
By
