Swing, Swing: Wild Week

The anticipation was palpable. Last week's consumer price index (CPI) report was in the spotlight, and it didn't disappoint relative to the "whisper" expectations that had moved lower heading into the report. Reflected in the risk-on mode of late last week was the likelihood that the Federal Reserve will "step down" to a 50-basis-point hike at the December Federal Open Market Committee (FOMC) meeting. They may even be able to step down thereafter to 25 basis points until they hit the so-called terminal rate (currently expected to be slightly below 5%).
What could provide some discomfort to the Fed in the meantime is the recent loosening of financial conditions—directly opposed to the Fed's goal of tighter financial conditions and a looser labor market. Recall the necessity of Fed Chair Jerome Powell taking a bluntly hawkish stance in his very short—but pointed—speech at the Fed's annual confab in Jackson Hole in August.
However, one (important) difference between the environment over the summer and now is that there was no data-based basis for the launch off the mid-June market low. Pivot hopes were just that—hopes. We were decidedly not in the camp that the Fed would soon have anything resembling a green light to pivot from aggressive rate hikes to rate cuts as soon as the first half of 2023. A pause-to-assess by the Fed, which we expect sometime in the first half of next year, is not the same thing as a pivot.
Better breadth
Unlike the summer rally, the rip higher in stocks late last week came in response to inflation data that was actually better than expected. It was also aided by the drop in bond yields and the continued retreat in the U.S. dollar. In addition, there are now 56% of S&P 500 stocks trading above their 200-day moving averages vs. 51% at the mid-August high—at which point the index was 330 points higher than it was as of Friday's close. We continue to believe the average stock will do well relative to the largest cap stocks (i.e., equal weight will continue to outperform cap weight).
The rally was also aided by quite dour investor sentiment conditions leading into last week. We have been pointing out the better (contrarian) environment for stocks—at least as it related to attitudinal measures of sentiment. Last week's "crypto carnage" (more on that below) was a likely trigger for behavioral sentiment measures finally falling into line with attitudinal measures.
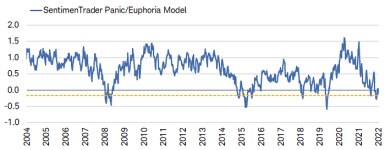
SentimenTrader's Panic/Euphoria Model, which is a blend of attitudinal and behavioral sentiment indicators, recently inflected higher from a historically low reading, as shown below. As the accompanying table highlights, although equity market performance was mixed historically in the near-term after similar inflections; it was universally strong a year later.
A little less panic
Source: Charles Schwab, SentimenTrader, as of 11/11/2022. Yellow dotted line represents -0.17 threshold. Past performance is no guarantee of future results.
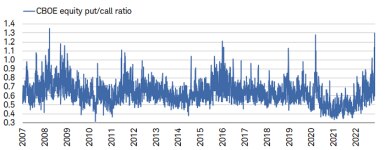
Also confirming the "catch down" by behavioral measures of sentiment, the CBOE equity put/call ratio spiked last Wednesday to 1.3; the highest reading since 2008, as shown below. However, given that it quickly retreated off Wednesday's high, and plunged alongside the sharp rally in stocks, sentiment is key to watch near-term as it risks becoming a bit frothy again if the rally persists.
Crypto carnage emboldens bears
Source: Charles Schwab, Bloomberg, as of 11/11/2022.
The fierceness of the late-week surge may mean stocks have already largely priced in the "second derivative" improvement in inflation, with consolidation risk having increased, especially if the Fed does have to push back (via jawboning) on the looser financial conditions aided by stocks' rally. In addition, in the early stages of rising inflation, earnings growth is supported via pricing power, until the commensurate hiking cycle and tightening financial conditions weighs on demand.
So, even though inflation has likely peaked—which takes some downward pressure off equity multiples—the denominator (earnings) in the P/E equation may be under increasing downward pressure. That, all else equal, puts upward pressure on equity multiples.
The empire gets struck
The aforementioned spike in bearish positioning, via measures like the put/call ratio, was directly related to the distressing collapse of FTX, one of the largest cryptocurrency exchanges. In a week's time, the company went from operating as one of the key players in the industry (second in size only to Binance), to filing for bankruptcy and threatening to bring down several firms in the process—dealing a serious blow to one of the largest and most notable crypto empires.
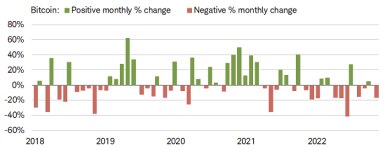
Naturally, cryptocurrencies and related stocks initially took a beating on the news. Bitcoin dropped last week by 20%, making November thus far the worst month since June (which saw a drop of more than 40%), as shown below.
Bitcoin sticking to its wounds
Source: Charles Schwab, Bloomberg, as of 11/11/2022. Past performance is no guarantee of future results.
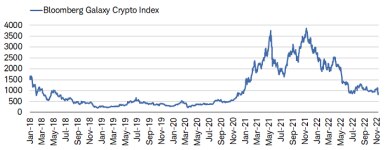
Taking a holistic look at the crypto ecosystem, last week's sharp declines were felt across many assets in addition to Bitcoin. The Bloomberg Galaxy Crypto Index fell by 23% last week and, as shown below, has fallen dramatically from its peak—suffering a 79% drawdown from its all-time high in November 2021.
In a galaxy far away
Source: Charles Schwab, Bloomberg, as of 11/11/2022. Bloomberg Galaxy Crypto Index is designed to measure the performance of the largest cryptocurrencies traded in USD. Indexes are unmanaged, do not incur management fees, costs and expenses and cannot be invested in directly. Past performance does not guarantee future results.
A cryptic spillover?
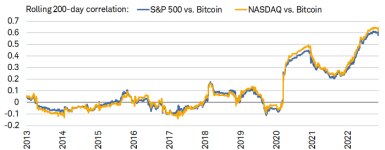
In the wake of the (ongoing) collapse of FTX, the initial response from the broader Wall Street community has been to assess contagion risk to traditional asset classes. The S&P 500 did indeed fall by 2% last Wednesday as crypto assets struggled, before the epic equity rally into the week's close. The rebound was quite impressive when considering that stocks and Bitcoin have never before been as connected as they were when FTX collapsed. As shown below, when comparing daily moves in the S&P 500 and NASDAQ relative to Bitcoin, rolling 200-day correlations are just off all-time highs (around 0.6).
Stocks and Bitcoin riding together
Source: Charles Schwab, Bloomberg, as of 11/11/2022. Correlation is a statistical measure of how two investments have historically moved in relation to each other, and ranges from -1 to +1. A correlation of 1 indicates a perfect positive correlation, while a correlation of -1 indicates a perfect negative correlation. A correlation of zero means the assets are not correlated. Past performance is no guarantee of future results.
It is indeed positive to see stocks rally coming off of Bitcoin's mid-week FTX-triggered implosion, not least because it underscores that a crash in crypto doesn't necessarily equate to the same fate for stocks. However, there are a couple points worth keeping in mind—primarily, the chart above confirms that stocks aren't completely out of the woods due to the still-elevated longer-term correlation with Bitcoin.
We'll need to see a series of performance divergences to confirm that crypto's struggles aren't hitting the stock market materially. That can't be ruled out just yet, partially given our suspicion that an increasing number of investors have had (and/or may still need) to liquidate equity positions in order to cover for any ongoing crypto weakness by way of margin calls.
Questionable quality
Additionally, we've taken little comfort from leaders in the recent stock rally having occupied the worst end of the quality spectrum. Last week's gains for cohorts like heavily shorted, non-profitable tech and meme stocks were some of the strongest in history. Notably, the non-profitable-tech-stock basket tracked by Goldman Sacks surged by 25% during last week's final two days—by far its best on record. That sounds impressive in isolation, but investors may want to fade that kind of move, not least because the market has shown little-to-no confidence in speculative leadership over the past year.
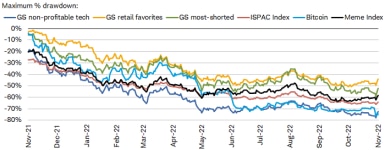
As shown below, last week's rally did little to chip away at losses over the past year. By way of example, even with last week's double-digit surge for non-profitable tech, the cohort is still down by more than 70% from its all-time high. Even the best performer in this group—a cohort of stocks favored by retail traders—is still down by more than 40% from its high.
Know when to fade 'em
Source: Charles Schwab, Bloomberg, as of 11/11/2022. Goldman Sachs (GS) non-profitable technology basket consists of non-profitable U.S.-listed companies in innovative industries. Technology is defined quite broadly to include new economy companies across GICS industry groupings. Goldman Sachs (GS) retail favorites basket consists of U.S. listed equities that are popularly traded on retail brokerage platforms. Goldman Sachs (GS) most-shorted basket contains the 50 highest short interest names in the Russell 3000; names have a market cap greater than $1 billion. ISPAC Index is a passive rules-based index that tracks the performance of the newly listed Special Purpose Acquisitions Corporations ("SPACs") ex- warrant and initial public offerings derived from SPACs since August 1, 2017. The Meme Index is constructed by Bloomberg and contains 37 stocks that are considered actively traded and/or discussed among day-traders, retail investors, and chatrooms. Individual stocks shown for informational purposes only. Indexes are unmanaged, do not incur management fees, costs and expenses and cannot be invested in directly. Past performance does not guarantee future results.
Fade, act II
Recent gains in the aforementioned areas have strong hints of the market's rally from mid-June through mid-August—when leadership was also concentrated down the quality spectrum. That proved to be a false signal for numerous reasons—including the aforementioned hopes for a Fed pivot. In addition, companies with poor fundamentals (or none at all) are simply not positioned to benefit from today's environment of higher rates and slower growth. With the Fed still engaged in its aggressive rate-hiking campaign, and a global recession unfolding, we see little reason as to why speculative segments of the market would maintain their place as longer-term leaders.
We continue to emphasize that stock-oriented investors should stay up the quality spectrum, and focus on factors like positive earnings revisions/surprises, strong free cash flow, healthy balance sheets, dividend growth, and high return on equity. There are times when moving down the quality spectrum makes some sense, as a way to "leverage" a potential sharp inflection higher in economic growth. Like with the incomprehensible "pivot perspective" that fueled the rally from mid-June to mid-August, last week's mildly positive inflation news is insufficient to suggest that inflection is upon us.
We'll conclude by revisiting the conclusion of our August 22nd report titled "Fade." To wit:
"The flash rally and crash of stocks like many of the memes should serve as an important reminder for investors: Neither 'get in' nor 'get out'—and/or 'get rich quick' schemes—are investing strategies. They simply represent gambling on moments in time—the antithesis of investing, which should be a disciplined process over time."
That's a good place to end.
 By
By
 By
By
