Identifying Head-and-Shoulders Patterns in Stock Charts

Take a look at any intraday stock chart and you’re bound to see head-and-shoulders patterns—a central peak flanked by two smaller peaks—popping out all over the place.
These triple-peaked chart patterns can be useful indicators of a major trend reversal but are also among the easiest to misread. Indeed, many investors have paid a steep price for placing a trade without waiting for signals confirming the pattern.
What to look for
To detect a true head-and-shoulders trend reversal, it helps to understand how they’re created:
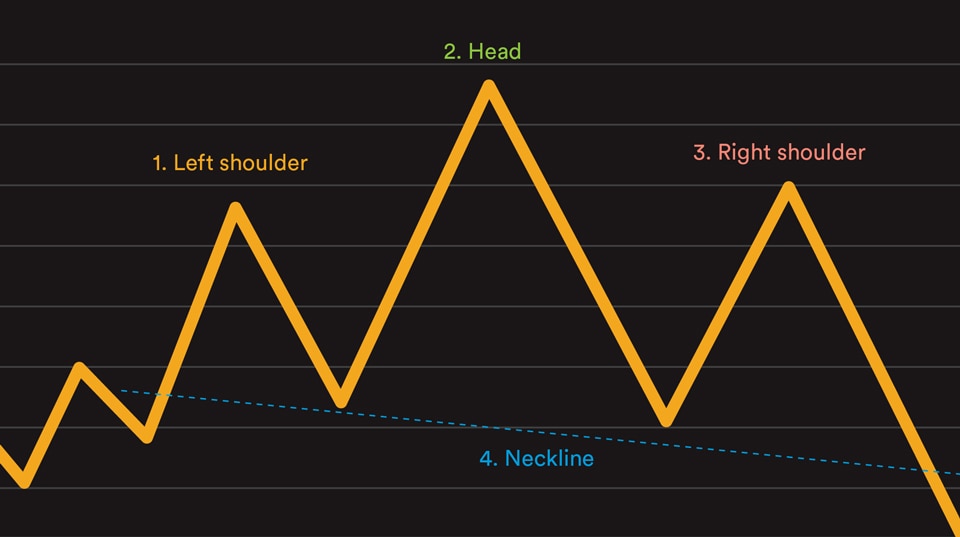
- The left shoulder forms when investors pushing a stock higher temporarily lose enthusiasm.
- The head forms when enthusiasm peaks and then declines to a point at or near the stock’s previous low.
- The right shoulder forms as the stock price rallies once again but fails to reach its previous high before falling again.
- A fourth component—the neckline—is formed by drawing a line underneath the troughs established just before and just after the head. When the stock’s price dips below this trend line, it’s usually a strong indication that the pattern has broken and it’s time to sell your position.
Note that inverse head-and-shoulders patterns—which are just the reverse, with the head and shoulders forming valleys instead of peaks—can also offer useful trading signals, but more on those below.
Confirming signals
Even when the stock price breaches the neckline, it doesn’t necessarily mean it’s a lock to continue in that direction. To help confirm the trend, you should consider two more factors:
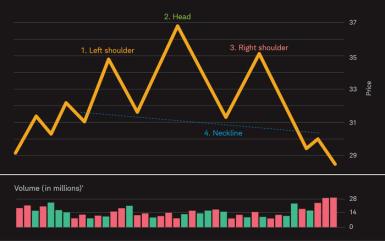
- Volume: The number of shares trading is one indication of the strength behind a price move. With a classic head-and-shoulders pattern (see chart above), you’ll see the trading volume start to lessen as the price moves higher toward the head and then again when it rebounds to form the right shoulder, indicating limited investor enthusiasm. A spike in volume when the price moves below the neckline suggests that selling pressure will remain intense. If neither of these volume signals is in play, the decline may be short-lived, though there are no guarantees.
- Time frame: Profitable trend reversals require strong trends leading into them. One commonly used rule of thumb is that the uptrend heading into the pattern should be at least twice as long as the distance between the shoulders. This makes it more likely that any reversal of the trend will be significant enough to trade, and that rule of thumb applies whether you’re looking at an intraday opportunity or a lengthier one.
Setting your stops
Now that you know what to look for, how do you trade it? By using some of the same risk-management tools that are part of your regular trading plan.
Stop orders, in particular, can be useful for head-and-shoulders opportunities, both for limiting your losses from downward price moves if you own the stock, and for initiating a position in an inverse head-and-shoulder when the stock breaks higher through the neckline. However, be aware that there is no guarantee a stop order will be executed at or near the stop price. (For profit-taking, consider placing limit orders at your target price.)
If you already own a stock and believe a traditional head-and-shoulders pattern may be developing, identify the potential neckline when the stock is forming the right shoulder and set your sell-stop price just below it. For instance, if the stock retreated to $35, rebounded to a new high of $37 and then retreated back to $35 before climbing back up, consider setting your sell-stop price just under the possible new support level of $35.
If you’re looking to add a position, the formation of an inverse head and shoulders, with a stock price breaking above the neckline, often indicates a bearish trend has ended and the stock is poised for higher highs. In such cases, set your buy-stop price just above the neckline. For example, if the stock rebounds to $35, retreats to a new low of $33 and then climbs back up to $35 before again declining, consider setting your buy-stop order just above perceived resistance at $35.
Measure twice, sell once
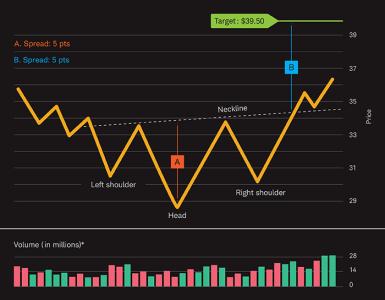
A unique feature of inverse head-and-shoulders patterns is that they can be used to estimate a profit target after the pattern is complete (as shown in the chart below). To determine the target spread:
- Measure the vertical distance from the head to the neckline.
- Find the breakout point—where the price first breaks the neckline after the right shoulder forms—and add that distance to the breakout price.
Target practice
Inverse head-and-shoulders patterns can help traders identify profit targets.
Some technical analysts believe this can give you a good sense for how far the price could climb based on the size of the pattern, and where you should consider setting your limit-sell price.
Patience is profitable
In my experience, those new to technical analysis tend to see head-and-shoulders patterns everywhere. That’s why taking the time to confirm signals, such as volume and the time frame of the preceding trends, is usually worth it. After a while, it will get easier to separate the heads and shoulders from the head fakes.
*Green volume bars indicate days on which the stock closed higher than the previous day; red bars indicate days on which it closed lower.
What You Can Do Next
Learn more about technical and fundamental analysis.
Explore trading at Schwab.
Schwab clients: Login to trade stocks.
 By
By

