Schwab Market Perspective: Ups and Downs

Lately it's felt like whenever we approach some degree of clarity on the economic situation, something unexpected occurs—and we're back to the drawing board.
Take the past week. The Federal Reserve was firmly on the path to continued aggressive rate hikes thanks to strong economic data—until turbulence struck the banking sector. Meanwhile, China has been showing signs of stronger-than-expected growth, a surprise after the world's second-largest economy missed its growth targets last year.
U.S. stocks and economy: Push and pull
The outlook for the U.S. economy has become murky—again. First, Federal Reserve Chair Jerome Powell spooked investors on March 7th by suggesting the central bank might need to raise short-term interest rates higher than previously expected to fight inflation. But within days, three bank failures jolted markets and led to speculation that the Fed might instead pause or slow its rate hikes in an effort to ensure financial stability.
This push-and-pull has been an aspect of the economy and markets for months. The U.S. economy added 311,000 jobs in February, following a 504,000-job gain in January. A strong pace of hiring suggests larger and/or more rate hikes will follow this year. But on the other hand, gains in the labor force participation rate (to 62.5% from 62.4%) and the unemployment rate (to 3.6% from 3.4%) indicate that more people are coming off the sidelines, looking for work, and not finding it—factors which argue for a gentler Fed approach.
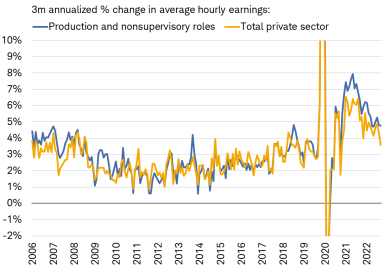
Slower average hourly earnings growth in February also indicated that the labor market is decelerating. However, as you can see in the chart below, the drop in overall wage growth is mostly due to a decline in higher-paying jobs. For nonsupervisory workers' wages (which are lower), growth has stabilized at just under 5% (at a three-month annualized rate), as hiring remains strong within that group.
Wage growth has declined unevenly
Source: Charles Schwab, Bloomberg, Bureau of Labor Statistics, as of 2/28/2023
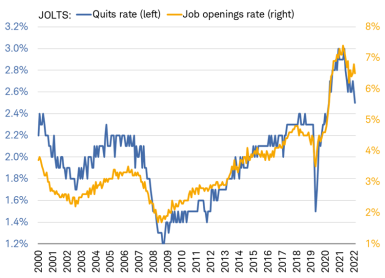
The recent Job Openings and Labor Turnover Survey (JOLTS) from the Bureau of Labor Statistics also provided mixed signals. Demand for labor eased in January—shown by the drop in the job openings rate in the chart below—but it hasn't broken through its recent low like the quits rate has. A lower quits rate suggests workers are less comfortable leaving their job in hopes of finding a new one. While the downward move suggests that worker confidence is ebbing, the rate itself remains high relative to its history.
Quits and openings rate fall at different rates
Source: Charles Schwab, Bloomberg, Bureau of Labor Statistics, as of 1/31/2023
JOLTS is a monthly survey of private nonfarm establishments and local government entities which provides information on total number of job openings, hires, and separations (voluntary quits and layoffs/discharges).
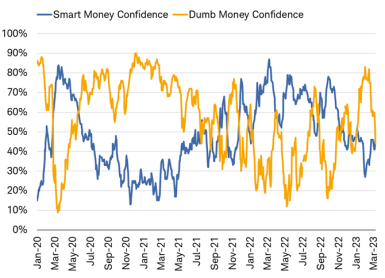
At the same time, average investor sentiment has weakened, which historically has been seen as a contrary indicator. SentimenTrader's "Dumb Money Confidence" index has moved sharply lower but is not in extreme-pessimism territory. Note that the index name isn't meant to imply that average investors are "dumb"; rather, it relies on a series of indicators that tend to capture trend-following in the market, which often peaks around the time a trend is becoming exhausted.
Investor sentiment takes a dive
Source: Charles Schwab, SentimenTrader, as of 3/10/2023
SentimenTrader's Smart Money Confidence and Dumb Money Confidence indexes are presented on a scale of 0% to 100%. When the Smart Money Confidence Index is at 100%, it means that those traders historically most correct on market direction are 100% confident of a rising market; when it is at 0%, it means those traders are zero percent confident in a rally. The Dumb Money Confidence Index works in the opposite manner. For illustrative purposes only.
Fixed income: What will the Fed do now?
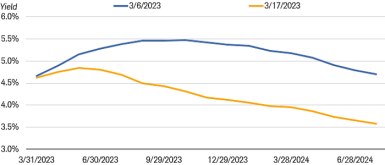
The recent turmoil in the banking sector shifted the landscape dramatically for fixed income markets. After discounting the potential for the federal funds target rate rising to as high as 5.5% or more in the next few months, expectations are now for a peak rate of 4.75% to 5%, suggesting at most one more quarter-point interest rate increase—or none at all--followed by rate cuts in the second half of the year. Long-term Treasury bond yields have also fallen sharply.
Expectations for the path of the fed funds rate have shifted lower
Source: Bloomberg, as of 3/17/2023
Market estimate of the federal funds rate using Fed Funds Futures Implied Rate (FFM2 COMB Comdty). For illustrative purposes only. Futures and futures options trading involves substantial risk and is not suitable for all investors. Please read the Risk Disclosure for Futures and Options prior to trading futures products. Futures accounts are not protected by SIPC.
Much of this change has to do with the swift action by the Fed and other agencies to shield depositors from the recent bank failures and address potential risks to the financial system. Although the Fed remains concerned about inflation, its commitment to maintaining financial system stability could lead it to pause or at least slow its rate hikes until the dust settles. It's even possible that hikes have ended for this cycle, but that will depend on the path of inflation.
Global stocks and economy: China surprises
At China's annual "Two Sessions" parliamentary meeting in early March, the leaders of the world's second-largest economy set a gross domestic product growth target of "around" 5% for the year, less than the 5.5% expected by most economists. Global commodity prices dipped in response to this modest target and lack of any announcement of major fiscal support—but there is an upside. A low bar is easier to clear, and actual economic growth may overshoot the target.
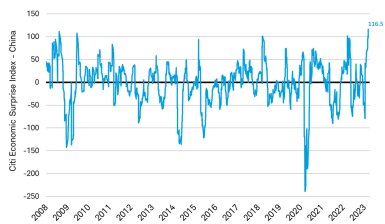
Indeed, economic data is already exceeding expectations by the widest degree in more than 15 years. The manufacturing purchasing managers index (PMI) rose into expansion territory for the first time in seven months in February, driven by a 23-month high in business confidence.
China's positive economic surprises rose to a 15 year high in February
Source: Charles Schwab, Macrobond data as of 3/10/2023
The main agenda item for this year's Two Sessions meeting was cementing new leadership changes under President Xi Jinping, including the premier and head of economic planning. The new economic team will be responsible for delivering on this year's targets after the old team missed targets last year.
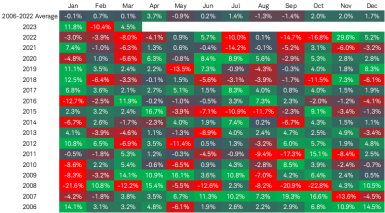
After rebounding nearly 60% from October to January, Chinese stocks (as measured by the MSCI China Index) pulled back heading into the Two Sessions meeting. April and November historically have been the best months for China's stock market, and the MSCI China Index posted the best monthly returns for the year after the Two Sessions meeting in March and plenary sessions in October. There can be no guarantees, but April tends to be the strongest and one of the most consistent months of the year for gains, as you can see in this heat map of monthly returns.
MSCI China Index typically strongest in April and November
Source: Charles Schwab, FactSet, data as of 3/6/2023
The MSCI China Index captures large and mid-cap representation across China A shares, H shares, B shares, Red chips, P chips and foreign listings (e.g. ADRs). With 717 constituents, the index covers about 85% of this China equity universe. In the heatmap, green is positive and red is negative; gradations of each color represent relative intensity of positive or negative performance. Indexes are unmanaged, do not incur management fees, costs and expenses, and cannot be invested in directly. Past performance is no guarantee of future results.
Even if the new economic team fails to unveil any new growth initiatives and growth comes in close to its 5% target, a less-robust recovery in China may not be all bad for investors. Modest growth may limit the impact to global inflation from China's 1.4 billion consumers, which could mean less need for restrictive global monetary policy responses— potentially a relief for stock prices battered by swings in the outlook for further rate hikes.
Tensions between the U.S. and China seem to be on the rise but are unlikely to impact the economic recovery. As we outlined in Investors' Guide to Geopolitical Risk, certain products and U.S. companies may face greater restrictions to being sold or investing in China, and the U.S. government may impose sanctions should it conclude that China aided Russia's war effort. However, China's recovery depends on domestic-led consumption, which is unlikely to be impacted by these tensions.
What investors can do now
The recent market volatility underscores the importance of sticking to your long-term plan, even when it's difficult to ignore the headlines and market noise. Remember that markets historically have fluctuated and recovered; this is nothing new. Tracking progress toward your long-term goal, not short-term performance, can make market swings easier to handle emotionally.
It's also important to embrace the practices of diversification and periodic rebalancing. Diversification means having a portfolio that is appropriately allocated (based on your goals, investing timeline and risk tolerance) to an array of investments, including U.S. and international stocks, bonds and cash. Rebalancing means periodically selling positions that have gained in value and become overweight to the rest of your portfolio, and using the proceeds to shore up positions that have become overweight. Rebalancing at regular intervals (for instance, annually) can help keep your portfolio in line with your original targets, leaving you potentially better positioned when markets change direction.
Kevin Gordon, Senior Investment Strategist, contributed to this report.
What You Can Do Next
Follow the Schwab Center for Financial Research on Twitter: @SchwabResearch.
Explore other topics on Insights & Ideas.
Talk to us about the services that are right for you. Call us at 800-355-2162, visit a branch, find a consultant or open an account online.
 By
By
 By
By
 By
By
