Schwab Market Perspective: The Pace of Rate Cuts

Listen to the latest audio Schwab Market Perspective.
Continued "stickiness" in U.S. inflation data has kept alive the question: When will the Federal Reserve begin to cut interest rates? Central banks in other countries are on the brink of cutting rates, but the Fed remains a wild card. This has implications for the Treasury market—which has been volatile—as well as for other major central banks in Europe, the U.K., and Canada, which normally do not allow a wide divergence between their benchmark rates and the U.S. policy rate.
U.S. stocks and economy: Sour sentiment but resilient labor
Despite a recent reheating in inflation pressures this year, it's notable that price growth has eased considerably over the past couple of years. The year-over-year change in the consumer price index (CPI) peaked at 9.1% in June 2022. As of April, the year-over-year change was 3.4%, confirming a marked slowdown in the rate at which prices are increasing. Still, though, that annual gain is faster than what the Federal Reserve is comfortable with and faster than the average leading up to the pandemic.
Not only has the continued stickiness in the inflation rate kept consumers on edge, but the level shift in prices over the past few years has been a considerable, if not dominant, driver of sour sentiment. As you can see in the chart below, per the latest consumer sentiment update from the University of Michigan, 40% of consumers say higher prices are the reason their financial position is worse compared with a year ago. Conversely, only 21% blame lower income.
Consumers have not yet adjusted to higher prices
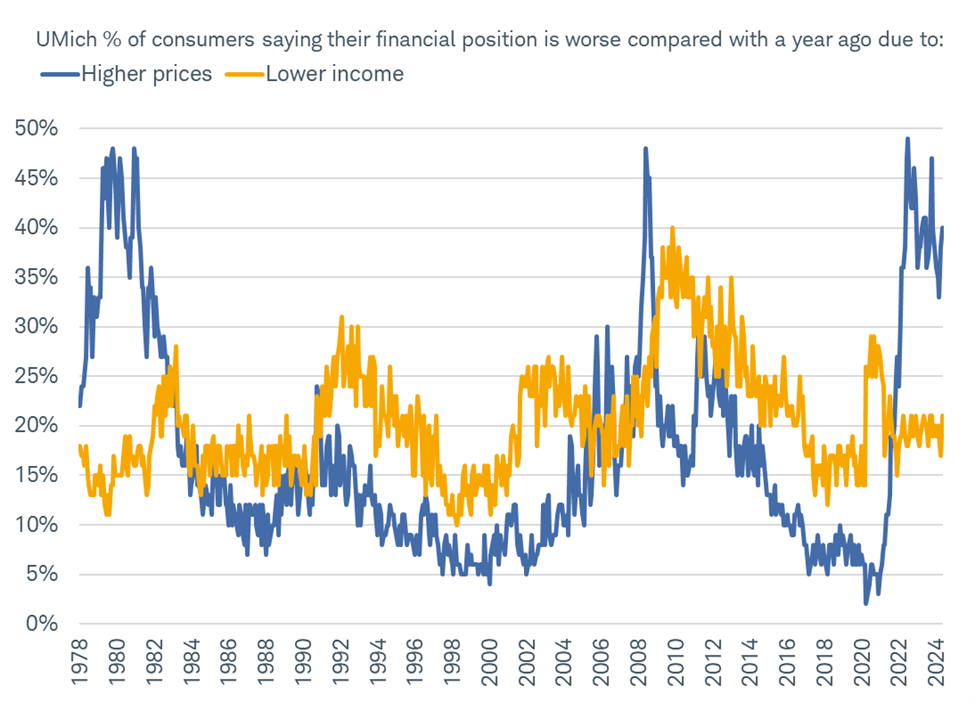
Source: Charles Schwab, Bloomberg, as of 5/10/2024.
As was the case in the disinflation process in the early 1980s, it could take a while for consumers to adjust to the level shift we've seen in prices—assuming the rate of inflation continues to ease, and the labor market remains intact. The good news is the latter looks promising for now, based on higher-frequency data like weekly jobless claims.
Continuing jobless claims—which measure the number of people who have continued to file for unemployment insurance—have leveled off over the past couple of months. As you can see in the chart below, after spiking to nearly 30%, the year-over-year change in continuing jobless claims has eased back considerably to single-digit territory. This is among many data points that underscore the unique nature of the current cycle. It hasn't been typical to see a jump in continuing claims of that magnitude reverse course sharply and without a recession.
Continuing claims' increase has slowed considerably
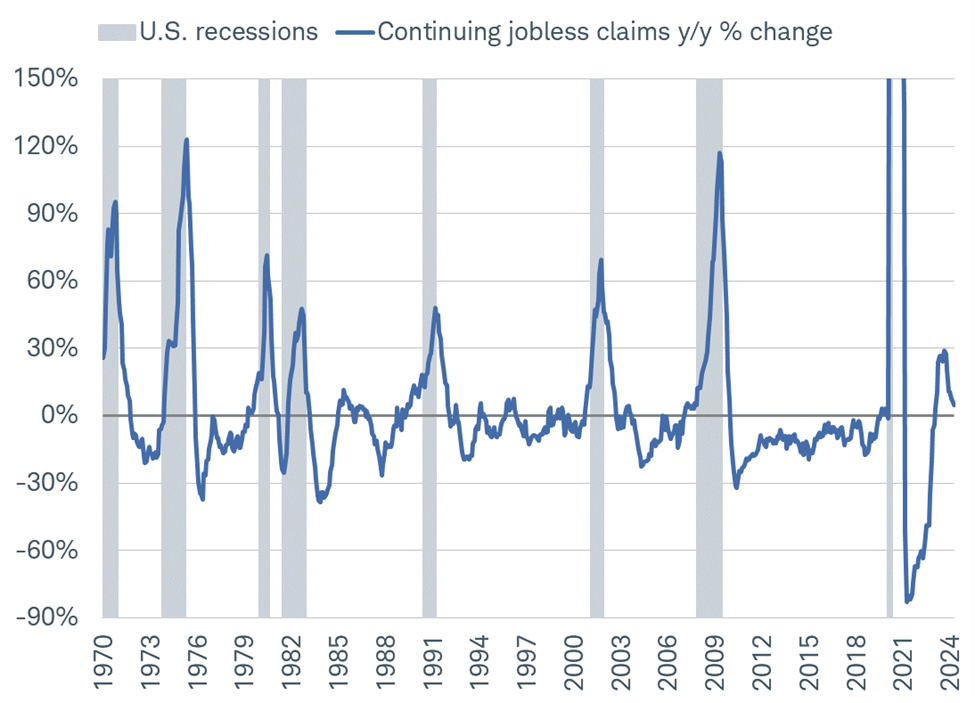
Source: Charles Schwab, Bloomberg, as of 4/27/2024.
Another unique aspect of the current cycle has been the lack of leadership lower down the market-capitalization spectrum. It's typically the case in bull markets that small-cap stocks gain considerably in the first couple of years—outperforming large-cap stocks in many instances. Yet, that has not been the case this time around: Since the October 12th, 2022, low and through this past April, the S&P 500 (which is composed of large-cap stocks) increased by 40.8% vs. a weaker 17% gain for the Russell 2000 (which reflects small-cap stocks).
While this is unusual, it's understandable given the difference in fundamentals. As you can see in the chart below, forward earnings per share (EPS) estimates for the S&P 500 have handily outpaced their prior cycle peak. Conversely, forward EPS estimates for the Russell 2000 are well off the highs last seen in mid-2022.
Large-cap earnings estimates have improved
Source: Charles Schwab, Bloomberg, as of 5/10/2024.
Forecasts contained herein are for illustrative purposes only, may be based upon proprietary research and are developed through analysis of historical public data. Indexes are unmanaged, do not incur management fees, costs and expenses and cannot be invested in directly. Past performance does not guarantee future results.
In an environment of higher interest rates, higher labor costs, and stickier inflation, it's clear that small companies that are less nimble will face tougher headwinds. That doesn't mean they will underperform in perpetuity, but their adjustment times are likely longer than those of their large-cap peers.
Fixed income: Higher for how much longer?
Uncertainty about the path of Federal Reserve policy remains the major driver of yields in the Treasury market. Volatility has come down from its recent peak, but it's still elevated compared to the pre-pandemic trend. We've heard from Fed officials that the federal funds rate target will be held higher for longer, but the question plaguing the markets is, "How much longer?" With no clear answer to that question, we expect swings in interest rates to continue.
One of the reasons for volatility is that, with the Fed "data dependent," each economic report is seen as an important signal. Consequently, yields have been on a roller-coaster ride over the past few months as resilient economic growth and stubborn inflation have shifted expectations. The market is currently discounting just one or two interest rate cuts of 25 basis points (or 0.25%) each this year, significantly lower than earlier this year, when as many as six cuts were expected.
Market expectations still imply Fed rate cuts this year
Source: Bloomberg and the Federal Reserve.
Market estimate of the Fed funds using Fed Funds Futures Implied Rate (FFX3 COMB Comdty). Market estimates as of 12/29/2023 and 5/13/2024, respectively, with "Median DOT Plot" from the 3/20/2024 FOMC meeting. respectively. For illustrative purposes only. Futures and futures options trading involves substantial risk and is not suitable for all investors. Please read the Risk Disclosure Statement for Futures and Options prior to trading futures products.
The Fed has a dual mandate to keep inflation low while aiming for full employment. Since the unemployment rate remains low, the Fed is squarely focused on inflation. In recent months, the inflation data have been disappointing. The inflation measure that the Fed uses for its benchmark, the deflator for personal consumption expenditures excluding food and energy prices, which tend to be volatile (known as "core" PCE) has stopped declining, leading the Fed to push back the start of rate cuts.
PCE inflation is trending lower
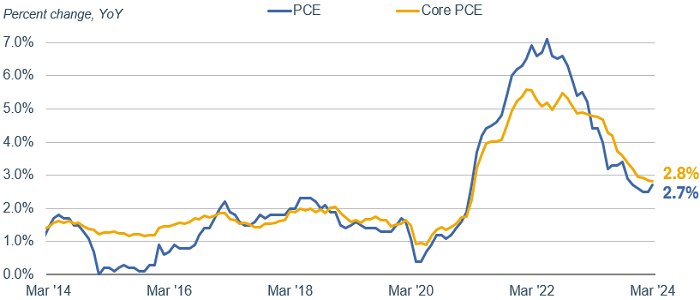
Source: Bloomberg.
PCE: Personal Consumption Expenditures Price Index (PCE DEFY Index), Core PCE: Personal Consumption Expenditures: All Items Less Food & Energy (PCE CYOY Index), percent change, year over year. Monthly data as of 3/31/2024.
The labor market has shown some signs of softening, with the unemployment rate ticking higher and wage growth slowing, but it still looks strong enough to withstand the current level of interest rates. Average hourly earnings are growing at a 3.9% rate, which is down from the pandemic-level peak but still well above the pre-pandemic level of about 3%.
Average hourly earnings growth remains above pre-pandemic average
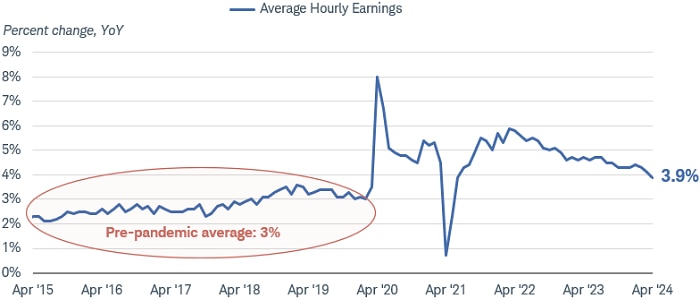
Source: Bloomberg.
US Average Hourly Earnings All Employees Total Private Yearly Percent Change SA (AHE YOY% Index). Data as of 4/30/2024. Note: Pre-pandemic date range is March 2015 to March 2020.
Similarly, consumer spending has continued to grow at a rate of more than 3%, based on the last U.S. gross domestic product figures. Although there are signs of some stress with delinquency rates on credit cards and auto loans rising, the overall trend indicates continued growth.
Nonetheless, Fed Chair Jerome Powell was clear in his latest comments that the likelihood of a rate hike is very low. The expectation is still that the next move by the Fed will be a rate cut. For investors, high uncertainty can make it difficult to navigate the market. However, we continue to suggest taking a long-term view. Consider extending the duration of fixed income holdings to match your objectives and time horizon. Holding some short-term investments for flexibility makes sense, but with the next move in yields more likely to be down than up, we see periodic spikes in yields as an opportunity to invest for income longer-term.
Global stocks and economy: Diverging rates risk?
Policy rates for major central banks appear set to diverge. The European Central Bank (ECB), Bank of England (BOE) and Bank of Canada (BOC), encompassing five of the Group of Seven economies, are expected to start cutting interest rates next month. The U.S. Federal Reserve (Fed) seems to be on hold. The Bank of Japan (BOJ) has begun raising its rates, for the first time in 17 years.
Market-based odds of June 25 basis point rate cut
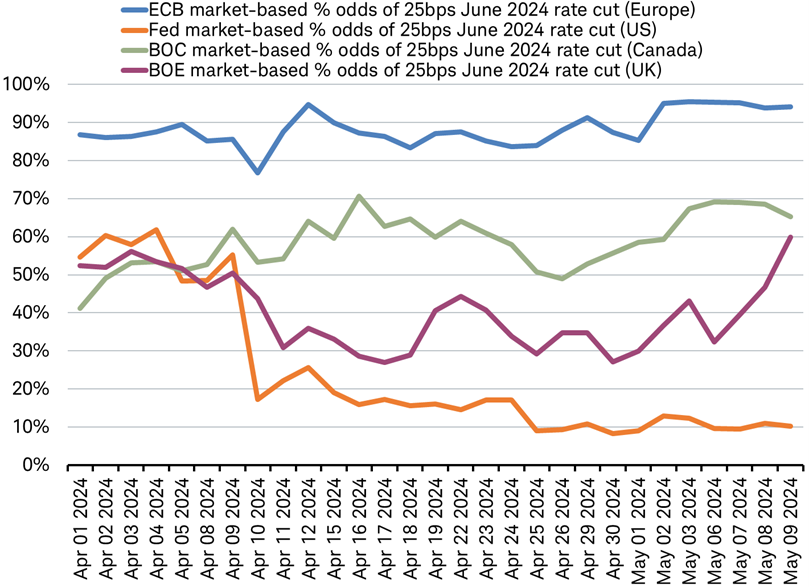
Source: Charles Schwab, Bloomberg data as of 5/9/2024.
Futures, and Futures options trading involves substantial risk and is not suitable for all investors. Please read the Risk Disclosure Statement for Futures and Options prior to trading futures products. Past performance is no guarantee of future results.
When asked about this potential divergence in his early May press conference, Fed chair Powell replied, "We all serve domestic mandates, right?" Other central bank leaders have voiced their agreement, declaring their independence from the U.S. Fed:
- European Central Bank President Christine Lagarde said last month, "we are data dependent, we are not Fed dependent."
- Bank of England Governor Andrew Bailey in early May said, "Inflation dynamics here are different to inflation dynamics in the U.S. [It's a] very different sort of situation in terms of our economies."
- Bank of Canada's Governor Tiff Macklem in early May stated, "We can run our own monetary policy so our interest rates in Canada don't need to be the same as the U.S. rate or global rates."
Yet Macklem followed his statement on rates by saying, "there is a limit to how far they can diverge—we're certainly not close to that limit." This suggests he sees potentially negative consequences if Canada's policy rates are cut too far below those of the U.S. But in Europe, Governor Fabio Panetta, head of Italy's central bank and a member of the ECB's Governing Council, suggested that higher Fed rates for longer would tighten global financial conditions and make even deeper eurozone rate cuts necessary to avoid a negative outcome. He stated, "If markets expect interest rates to drop, but the Fed keeps them unchanged…the rest of the world faces an unexpected monetary tightening." These views prompt a few questions for us to attempt to answer: Is there a limit to divergence? If so, where might it be? And what might happen if that limit is crossed?
Addressing Macklem's point, most central banks charged with managing inflation may see the risk of crossing some theoretical limit in the form of a potential inflationary shock, resulting from a weaker currency that makes imports more expensive. History shows that policy interest rate divergences—or even expected divergences—can move exchange rates, but not every time and typically not by very much. Looking back at the past 30 years of transparent central bank communications, policy interest rates have generally moved in sync—especially when they were being cut, as you can see in the chart below. But there were two notable periods where they diverged: The U.S. raised rates more aggressively than the other major central banks in 2004-2007 and from 2015-2018. Yet during both of those periods the euro, pound, and Canadian dollar were generally stable or stronger against the U.S. dollar.
Policy rates have rarely diverged
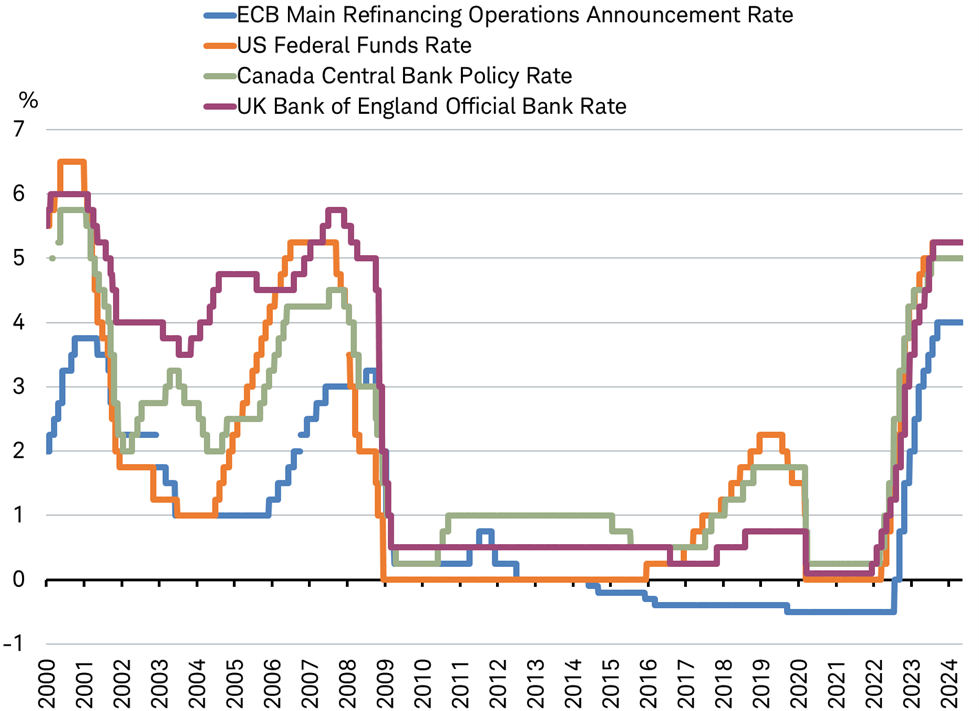
Source: Charles Schwab, Bloomberg data as of 5/9/2024.
Presently, the large divergence in expectations for policy interest rates in 2024 has not been accompanied by major moves in exchange rates that invited an acceleration of inflation. Since the start of February, as stronger U.S. economic and inflation data prompted the outlook for Fed rate cuts this year to pull back, the policy rate the market priced in for year-end 2024 rose by 1.2 percentage points, from 3.7% to 4.9%. Note that the current policy rate target is 5.25% to 5.50%. Over the same period, the euro is only slightly (-0.8%) lower against the U.S. dollar. Importantly, inflation did not surge; rather European inflation has continued to decline in 2024—supporting Macklem's view that the theoretical limit on policy rate divergence remains some distance away.
Again, looking back at the past 30 years, regardless of how currencies moved, it was rare for inflation to materially accelerate during rate-cutting cycles in the United States, Europe, Canada, or the United Kingdom. Core inflation typically fell in the U.S. and Europe. While more often than not it rose modestly in the U.K. and Canada, the worst of the periods for inflation saw a rise of less than one percentage point. This supports Panetta's statement that the ECB should not restrict rate cuts for fear of diverging too widely from what the Fed does.
Rate cut cycles and inflation
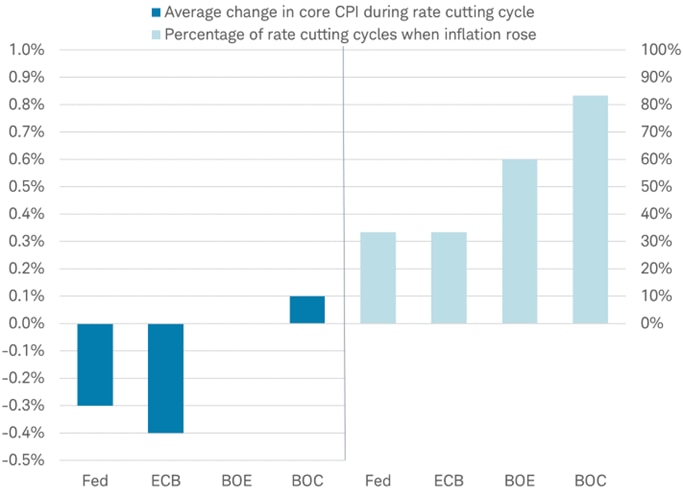
Source: Charles Schwab, FactSet data as of 5/9/2024.
The average change in core CPI during a rate-cutting cycle by the BOE is zero.
In short:
- Is there a limit to the divergence in monetary policy? Yes.
- Where is it? Very likely at a much wider level than the currently expected divergence in policy rates.
- What might happen if that limit is crossed? A potentially modest move higher in inflation driven by currency depreciation for those countries where rates diverge sharply below those of the Fed.
The history of rate cuts, exchange rates and inflation indicates that the coming divergence in policy rates is unlikely to pose a meaningful risk to investors.
Kevin Gordon, Director, Senior Investment Strategist, contributed to this report.