Patience: Inflation's Message to Fed

There's an old adage about Federal Reserve rate cycles: the Fed takes the escalator up and the elevator down. Because of the deleterious impact higher rates has on the economy, the Fed is usually more methodical when hiking rates. On the other hand, the Fed has historically been more aggressive when cutting rates, especially when combatting recessions. This time is different.

For illustrative purposes only.
Given the pandemic-related surge in inflation, the Fed embarked on the most aggressive tightening cycle in more than 40 years—moving the fed funds rate off the zero bound in March 2022. With 11 hikes overall between then and last July—and four consecutive 75-basis-point hikes therein—the Fed clearly took the elevator up. With the Fed in "pause" mode for now, attention has turned to the coming rate cut cycle. The rub is the lack of cooperation by inflation data, which has been a bit sticky this year and not yet at the Fed's 2% target.
With that as a backdrop, let's review the latest inflation readings. This past Friday, with the markets closed, February's PCE (personal consumption expenditures) deflators—preferred by the Fed—were released. As shown in the charts below, headline PCE rose 0.33% month-over-month, putting the year-over-year increase at 2.5%. Core (ex-food/energy) PCE rose 0.26% month-over-month, putting the year-over-year increase at 2.8%. Unfortunately, the three-month rates of change have hooked up meaningfully, while January's month-over-month increase was revised higher. A focus of the Fed has also been core services ex-shelter (not shown below), which did tick down to 3.3% year-over-year.
Stubborn headline PCE
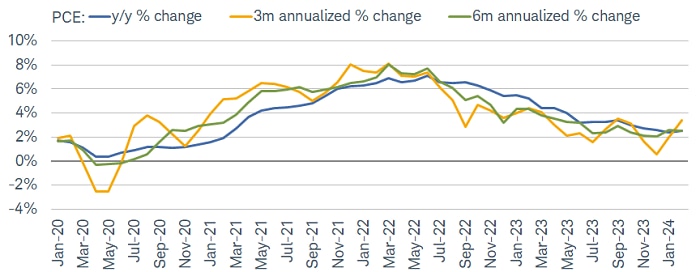
Source: Charles Schwab, Bloomberg, Bureau of Labor Statistics, as of 2/29/2024.
Core PCE not near Fed's target
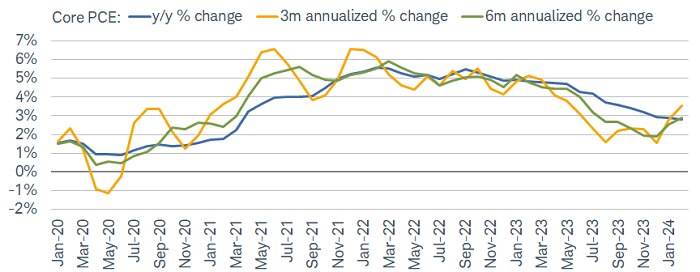
Source: Charles Schwab, Bloomberg, Bureau of Labor Statistics, as of 2/29/2024.
All else equal, the slightly lower-than-expected increase in core PCE in February supports the Fed's view that the recent acceleration had some seasonal quirks associated with it. However, the strength of personal spending (more on that below) suggests the Fed does not yet have a green light to start cutting rates.
Prior to Friday's PCE release was the February consumer price index (CPI), released in mid-March, charts of which are shown below. The annual rate of core CPI did tick down from 3.9% to 3.8%; but it was the second consecutive 0.4% month-over-month increase. That release preceded the March Federal Open Market Committee (FOMC) meeting, at which Fed Jerome Powell said the Fed needed "greater confidence" before beginning the easing part of the cycle.
Stubborn headline CPI
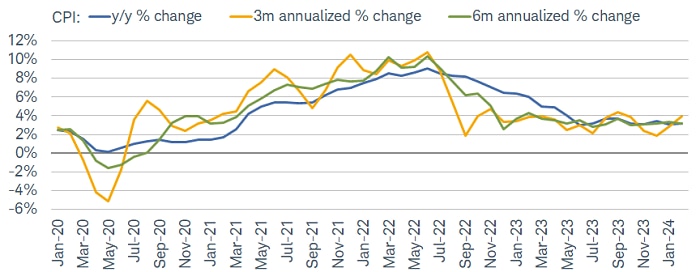
Source: Charles Schwab, Bloomberg, Bureau of Labor Statistics, as of 2/29/2024.
Core CPI not near Fed's target
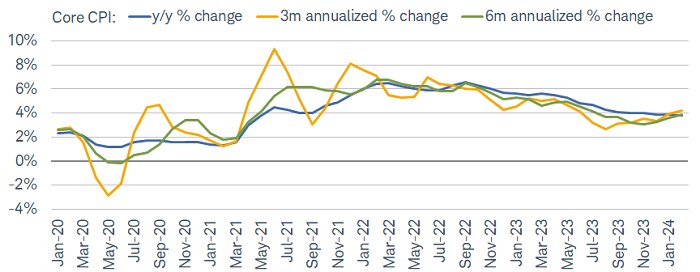
Source: Charles Schwab, Bloomberg, Bureau of Labor Statistics, as of 2/29/2024.
Notwithstanding the recent turn higher, disinflation has been significant since the CPI peaked in mid-2022. But here's the rub. Whether it's Fed watchers, market analysts, or economists, inflation is measured in month-over-month change or year-over-year change terms. Consumers, on the other hand, typically think of inflation in level terms. As shown below, headline CPI prices remain about 20% higher than they were just prior to the onset of the pandemic, with core CPI prices not far behind.
Level paints a different picture
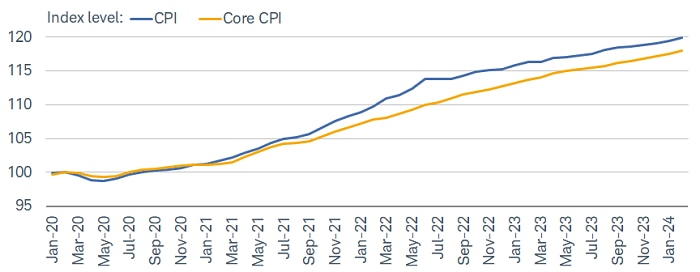
Source: Charles Schwab, Bloomberg, Bureau of Labor Statistics, as of 2/29/2024.
Data indexed to 100 (base value = 2/29/2020). An index number is a figure reflecting price or quantity compared with a base value. An index number is a figure reflecting price or quantity compared with a base value. The base value always has an index number of 100. The index number is then expressed as 100 times the ratio to the base value.
Mind the (closing?) gap
Another crucial datapoint released last week was the revision for gross domestic product (GDP) growth in the fourth quarter of 2023. Normally, the third (and final) revision doesn't get too much attention—not least because it comes a quarter after the quarter being reported is finished and because revisions are often negligible. Au contraire, revisions under the surface were quite strong. In quarter-over-quarter annualized terms, real GDP growth was revised up from 3.2% to 3.4%. Much of that was driven by an upward revision in personal spending (from 3% to 3.3%), and all of personal spending's upward revision was driven by better-than-expected services spending (from 2.8% to 3.4%).
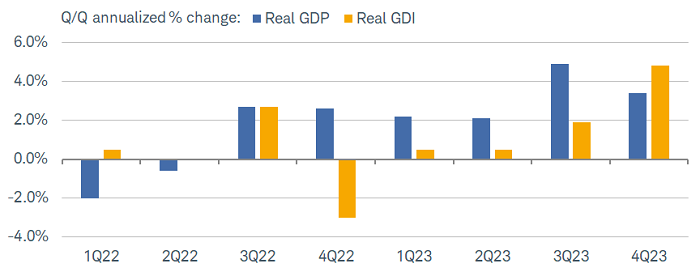
Each final GDP revision also brings the quarterly reading for gross domestic income (GDI). For similar reasons mentioned above, GDI doesn't tend to get a ton of attention. However, there was intense focus on it this time, given GDP and GDI have been diverging over the past year. As shown in the chart below, real GDI growth had been lagging real GDP growth from the end of 2022 through the third quarter of 2023. That's not unusual, but the width of the gap was a concern given worries that GDP was overstating growth and would catch down to GDI.
GDI swings back higher
Source: Charles Schwab, Bloomberg, as of 12/31/2023.
Fortunately, that wasn't the case. Not only did GDI come in quite strong, it outpaced GDP for the first time since the end of 2020. Much of that was driven by the stock and bond market rallies in late 2023, as net dividends increased by 31.4% in the quarter. For now, it looks as if GDI is catching up to GDP, which continues to support the notion that the economy is staying relatively resilient.
A tired consumer?
As we mentioned in our outlook for 2024, we believe if the labor market continues to soften and the consumer savings stash dwindles, there will be less scope for consumption to drive economic growth throughout the year. That doesn't mean spending falls into negative territory, but it's worth noting the exhaustive signs that are appearing in some spending data.
As shown in the chart below, through February, real spending has been outpacing real disposable personal income growth for most of the past year (in terms of magnitude). February alone saw a notable decline in income growth relative to spending, which means consumers dipped further into their savings to fuel their purchases. That brought the personal savings rate down to 3.6%, the lowest since December 2022.
Spending outpaces income
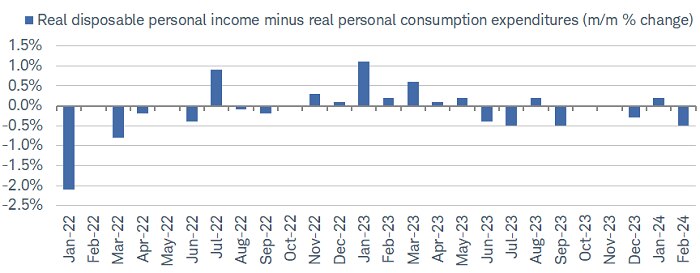
Source: Charles Schwab, Bloomberg, as of 2/29/2024.
Moving up the wealth and income spectrum, there's less of a concern given those households have a relatively larger savings stash and have benefited from the rally in risk assets. However, it's down the income spectrum where there's less of a savings cushion and more risk, especially if the labor market hits a rough patch. For now, the economy continues to add jobs at a brisk pace—much to the benefit of consumers who earn less.
We think a continuation of the rolling recessions/recoveries in certain pockets of the economy is still the best-case scenario for the broader economy. Indeed, we are now seeing the roll through affect segments of consumer spending and the labor market, all while manufacturing and housing have shown signs of improvement. The key will be whether any coming hits are small enough—or pockets of strength serve as offsets—to keep the consumer spending and thus the broader economy out of a traditional recession.
In sum
Inflation has shown some stubbornness this year; with the path likely to remain uneven en route to/near the Fed's target. Per the press conference following the March FOMC meeting, Chair Powell noted that recent inflation readings "…haven't really changed the overall story which is that of inflation moving down gradually on a sometimes-bumpy road toward two percent. I don't think that story has changed. I also don't think that those readings added to anyone's confidence that we're moving closer to that point." More recently, in a conversation at the San Francisco Fed last week, Powell said, "We will be careful about this decision…because we can."
The stock market has been quite resilient alongside changing expectations around Fed policy. As a reminder, at the start of this year, the market (though not us), evidenced by fed funds futures, was expecting a March start and six-to-seven cuts this year. That has now shifted to a June or July start, with only two-to-three cuts. We believe this will continue to be a moving target as relevant data (both inflation and labor market) is released. Particularly if the economy remains resilient, the Fed is eyeing the escalator, not the elevator.