Quarterly Market Outlook: Waiting for the Fed

When will the Federal Reserve begin cutting interest rates? That's the question that has dogged markets for the past few months. Expectations about the timing and magnitude of interest rate cuts have changed dramatically. Earlier this year, the federal funds futures market had priced in as many as six 25-basis-point (0.25%) cuts to the federal funds target rate. Now that number is down to three, implying a year-end federal funds rate of 4.75%. Some are even suggesting that the Fed won't lower interest rates this year at all, due to the strength of the economy and the risk that inflation will remain too high.
One reason for the volatility in expectations is that the Fed has pushed back on the prospect for a rapid pace of rate cuts. Rather, it has indicated that it is "data dependent," watching every data point to assess the next policy move. That leaves investors to react to every economic indicator and extrapolate the results into the future, creating a bumpy road for markets. We still see room for the Federal Reserve to cut by three-quarters of a point this year, but if inflation continues to come in stronger than expected, the Fed might prefer to hold the rate elevated and cut less than expected.
Two-year Treasury yields have traded in a wide range over the past few weeks on mixed economic data but most recently settled near 4.65%. Because two-year yields tend to correlate with expectations for the federal funds rate one year into the future, the level implies expectations for about 75 to 100 basis points in rate cuts over the next year, which is aligned with our view.
Two-year Treasury yield tends to correlate with expectations for federal funds rate one year in the future
Source: Bloomberg. Data as of 3/11/2024.
Generic United States 2 Year Government Note (GT2 Govt) and US Federal Funds Effective Rate (continuous series) (FEDL01 Index). Past performance is no guarantee of future results.
U.S. stocks and economy: Improving breadth
Investor sentiment and stock market valuations are getting increasingly stretched as indexes trek higher, but solid underlying breadth has been a positive offset. However, there is a lot going on beneath the surface.
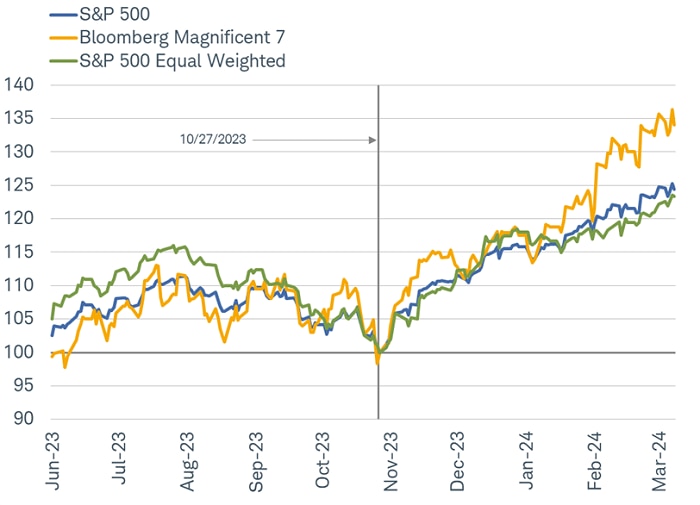
Investors have been enthusiastic about the "Magnificent 7" (Alphabet, Amazon, Apple, Meta, Microsoft, Nvidia, and Tesla) and other mega-cap stocks. When viewed as an index, the Mag7 have outperformed the broader market since October 27, 2023, the trough of the S&P 500 index's most recent 10% correction. However, both the market-capitalization-weighted and equal-weighted S&P 500 indexes have tracked closely with each other, indicating that the "average" stock is doing relatively well and market breadth is broadening out—a welcome shift given the dominance of the market-cap-weighted index last year.
Equal-weight and market-cap S&P 500 indexes are moving more closely in sync
Source: Charles Schwab, Bloomberg, as of 3/8/2024.
The Bloomberg Magnificent 7 Index is an equal-dollar-weighted equity benchmark consisting of a fixed basket of seven companies: Alphabet, Amazon, Apple, Meta, Microsoft, Nvidia and Tesla. Data indexed to 100 (base value = 10/27/2023). The S&P 500® Equal Weight Index (EWI) is the equal-weight version of the widely-used S&P 500; the index includes the same constituents as the market-capitalization-weighted S&P 500, but each company in the S&P 500 EWI is allocated a fixed weight. Indexes are unmanaged, do not incur management fees, costs and expenses and cannot be invested in directly. Past performance does not guarantee future results.
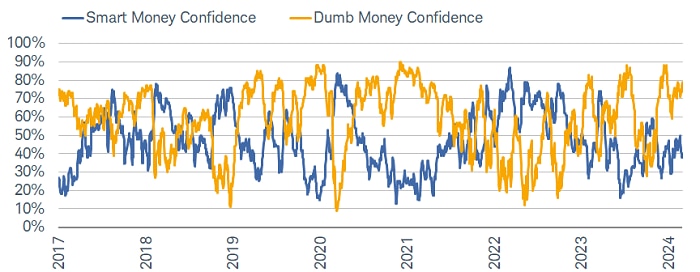
Enthusiasm around the Mag7 and other mega-cap stocks has contributed to a stretched sentiment environment. As shown in the chart below, SentimenTrader's "Dumb Money Confidence" (DMC) is back in excessive optimism territory and hovering near the upper end of its historical range. That's mostly to be expected, given the DMC crew tends to get most exuberant at market peaks and most dour at market bottoms. Conversely, the "Smart Money Confidence" (SMC) crew usually turns quite bullish at market bottoms and thus moves inversely with the DMC. (Note that "smart" and "dumb" have nothing to do with investors' intelligence—the index relies on indicators that tend to capture market-trend following behavior, which often peaks around the time a trend is becoming exhausted.)
Yet, in an odd twist, both confidence indexes have moved higher recently. Per SentimentTrader, there have been only five prior instances in the indexes' history when both increased by at least 10% over the prior month and were at or above the 50% threshold (as was the case in early March). Forward returns in those periods—1999, 2004, 2007, 2013, and 2023—were mixed, especially since two of those years preceded rough bear markets.
Market confidence has risen
Source: Charles Schwab, SentimenTrader, as of 3/1/2024.
SentimenTrader's Smart Money Confidence and Dumb Money Confidence Indexes are used to see what the "good" market timers are doing with their money compared to what the "bad" market timers are doing and are presented on a scale of 0% to 100%. The 70% level and above is considered "extreme optimism." When the Smart Money Confidence Index is at 100%, it means that those most correct on market direction are 100% confident of a rising market. When it is at 0%, it means good market timers are 0% confident in a rally. The Dumb Money Confidence Index works in the opposite manner.
Strong sentiment in and of itself is not a contrarian market timing tool (and vice-versa in times of pessimism). It is true that for many sentiment metrics, the current zone of optimism tends to be consistent with weak forward equity returns; however, a negative catalyst is typically needed to push stocks in the other direction. This could come in the form of surprises in economic and/or inflation data, adjustments in the outlook for Federal Reserve policy, or a breakdown in the market's underlying breadth.
Global stocks and economy: Cardboard box recovery
We use the phrase "Cardboard Box" recession to describe the 2023 global downturn, which included last year's recessions in Japan and the United Kingdom, because the weakness was concentrated in manufacturing and trade of goods—things that tend to go in cardboard boxes.
But as we forecast in our 2024 annual outlook, it appears a "Cardboard Box" recovery is now getting underway. The latest data show that both actual demand for cardboard boxes and sentiment by business leaders in manufacturing have moved back to expansion. The global manufacturing Purchasing Managers' Index (PMI) hit 50.3 in February, its first reading in 18 months above the 50.0 mark that divides growth from contraction. A rise in the new orders component of the survey signaled more growth is likely.
Global manufacturing returns to growth
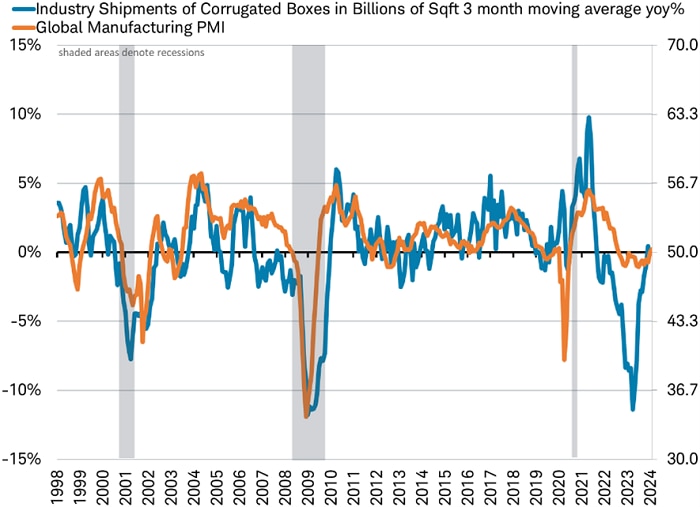
Source: Charles Schwab, Fibre Box Association, S&P Global, Bloomberg data as of 3/8/2024.
If the recovery continues, we might see a change in economic and market sector leadership from last year. We expect a brighter outlook for economic and earnings growth from more manufacturing-based sectors and economies, such as Japan.
However, it's worth keeping in mind that a series of global elections are coming up this year, with voters in more than 80 nations and territories heading to the polls. Results may skew toward nationalist policies that could lead to higher tariffs and trade frictions, potentially boosting inflation and weighing on exports—but which could also boost growth in domestic industries to counter inflationary effects.