Weekly Trader's Outlook
Stocks Close Out Volatile Week On a High Note

The Week That Was:
If you read last week's blog, you might recall that my outlook for this week called for "choppy sideways consolidation" with a "slightly bullish" bias. On the week, the S&P 500 lots of up and down swings (trading in a 2.4% range) and is up nearly 0.5% for the week at the time of this writing, so I'd say the forecast turned out to be correct. My outlook was certainly assisted by this morning's soft jobs report, which is sending the SPX higher by over 1% (more on the jobs data in the "Economic Data, Rates & the Fed" section below). Investor sentiment is likely also getting a boost from last night's upbeat earnings report from Apple. The iPhone maker reported better-than-feared China sales, forecasted a return to revenue growth for the current quarter and announced the largest corporate stock buyback in history at $110B. Other key tech earnings reports from earlier this week were mixed–Amazon posted strong results and stronger than expected AWS growth (17% vs. 14.8% est), but AMD's in-line quarter and SMCI's higher, but not high enough, guidance disappointed investors (falling 9% and 14% respectively post results). While there's still a high level of uncertainty around inflation, how many, if any, rate cuts we'll get this year, and to what extent current policy is hindering the economy, this week's data points appeared to incrementally shift in favor of the bulls.
Outlook for Next Week:
At the time of this writing (2:10 p.m. EDT), all of the major indices are up over 1.25% each and near the highs of the day (DJI + 490 to 38,716, SPX + 69 to 5,133, COMP + 340 to 16,181). It's encouraging to see the SPX above its 50-day SMA and would be incrementally bullish it can register a close above this indicator (5,129). Next week we'll still get several high-profile earnings reports, but the calendar is scant in terms of economic data. Given today's dovish shift in sentiment, I think the light economic calendar is a net win for the bulls next week (meaning no "strong" economic data to counter this morning's "goldilocks" jobs data). Therefore, my forecast for next week is "slightly bullish." What could challenge this outlook? Since I don't have the luxury of knowing whether or not the SPX will close above its 50-day SMA, a close below this indicator or failure to reclaim it early next week has the potential to sour investor sentiment, at least technically speaking.
Other Potential Market-moving Catalysts:
Economic:
- Tuesday (May 7): Consumer Credit
- Wednesday (May 8): EIA Crude Oil Inventories, MBA Mortgage Applications Index, Wholesale Inventories
- Thursday (May 9): Continuing Claims, EIA Natural Gas Inventories, Initial Jobless Claims
- Friday (May 10): Treasury Budget, University of Michigan Consumer Sentiment - Preliminary
Earnings:
- Monday (May 6): Tyson Foods Inc. (TSN), BioNTech SE (BNTX), Vertex Pharmaceuticals (VRTX), Microchip Technology Inc. (MCHP), Palantir Technologies Inc. (PLTR), Realty Income Corp. (O), Simon Property Group Inc. (SPG)
- Tuesday (May 7): Walt Disney Co. (DIS), BP PLC (BP), Duke Energy Corp. (DUK), Datadog (DDOG), Arista Networks (ANET), McKesson Corp. (MCK), Occidental Petroleum Corp. (OXY), Coupang (CPNG), Astra Labs Inc. (ALAB)
- Wednesday (May 8): Uber Technologies (UBER), Anheuser-Busch Inbev SA (BUD), Arm Holdings (ARM), Airbnb Inc. (ABNB), Trade Desk Inc. (TTD), HubSpot Inc. (HUBS)
- Thursday (May 9): Constellation Energy Corp. (CEG), Roblox Corp. (RBLX), Hyatt Hotels Corp. (H), Mettler-Toledo International Inc. (MTD), Akamai Technologies Inc. (AKAM)
- Friday (May 10): DigitalOcean Holdings Inc. (DOCN), Construction Partners Inc. (ROAD)
Economic Data, Rates & the Fed:
There was a lot for markets to digest this week on the economic front which included a Federal Open Market Committe (FOMC) Meeting and the monthly jobs report. This morning's Nonfarm Payrolls report was viewed as a "goldilocks" report for the bulls with a combination of weaker-than-expected job gains, a higher unemployment rate and lower-than-expected wage gains. This week's FOMC meeting also seemed to get a relatively positive response from stock investors as Federal Reserve Chairman Powell conveyed that the current policy is restrictive enough to get inflation down, putting concerns for the potential of a rate hike to rest. Here are the highlights from the batch of data received this week:
- Nonfarm Payrolls Report: 175K vs. 240K estimate (with 22K in downward revisions of to the prior two months); The Unemployment rate ticked up to 3.9% from 3.8% in the prior month and above the 3.8% expected; Average Hourly Earnings +0.2%, below the +0.3% expected with the year-over-year gain at 3.9%, below the 4.0% estimate.
- FOMC Meeting Highlights: Fed funds rate left unchanged (5.25-5.50%); the Federal Reserve announced a slowing of the pace of its balance sheet drawdown (i.e. allowing holdings to mature rather than be replaced) in Treasury securities to just $25B per month from $60B. In the follow-up press conference, Powell noted that inflation is still "too high" but believes current policy is restrictive, which provided relief to market participants concerned that a rate hike could be on the table. In response to a reporter's question about stagflation following last week's 1.6% advanced Q1 GDP read, Powell downplayed the idea, noting that by some measures, economic growth is at 3% and inflation is below 3%. Powell stated, "I don't see the 'stag of the '-flation'".
- Employment Cost Index (ECI) increased 1.2% for the first three months of the year, which is up from 0.9% in the prior quarter and above the 1.0% economists had expected. This represented the biggest increase since Q1 of 2023.
- JOLTS – Job Openings came in at 8.488M, down 1.1M year-over-year and below the 8.686M expected and represents the lowest level since February of 2021.
- Consumer Confidence came in at 97.0 down from 104.7 in the prior month and below the 104.0 economist's expectations. This represents the lowest level since July of 2022.
- ISM Manufacturing Index came in at 49.2% in April, down from 50.3% in March and below the 50.5% expected. Within the report, the New Orders Index moved down to 49.1 from 51.4 in March while the Prices Index increased 5.1% from the prior month to 60.9, representing the highest level since June of 2022.
- S&P Global US Manufacturing PMI came in at 49.9 (any reading below 50 is considered "contraction territory), down from 51.4 in March and below the 52.0 expected. Within the report, the Prices Paid Index climbed to 59.2 from 53.4 in the prior month while the Employment Index dropped to 45.9 from 48.5 in the prior month. representing a four-month low.
- S&P Global US Services PMI came in at a five-month low of 50.9, down from 51.7 in March.
- Initial Jobless Claims dropped 5K from the prior week to a seasonally adjusted 207K, below the 215K economists expected, continuing to convey a tight labor market.
- ISM Services PMI: came in at 49.4 (any reading below 50 is considered "contraction territory), down from 51.4 in March and below the 52.0 expected. Within the report, the Prices Paid Index climbed to 59.2 from 53.4 in the prior month while the Employment Index dropped to 45.9 from 48.5 in the prior month.
- The Atlanta Fed GDPNow current expectation (nowcast) for Q2 GDP was revised down to 3.3% on May 2nd from 3.9% on April 26th (quarter-over-quarter, annualized).
Bond yields dropped this week, primarily driven by this morning's Nonfarm Payrolls report. After hitting a fresh five-month high of 5.046% on Tuesday, yields on two-year Treasuries are down to 4.804% this morning (note: 5.20% is the cycle high for the two-year). Yields on the 10-year (TNX) are down roughly 15 basis points week-over-week to a three-week low of 4.512% currently. The move lower is welcome news for equity investors and the hope is that the uptrend in yields in 2024 will begin to shift, driven by slowing economic growth and inflationary pressures.
Market hopes around the potential for Fed rate cuts saw an uptick this week following the cooler than expected monthly jobs report. Coming into the week, the Bloomberg probability of a June rate cut was 12% but has moved up to 15% currently and the July rate cut probability currently stands at 43%, up from 31% at the start of the week. Based on the 65% threshold (which represents the approximate line in the sand for a Fed action, either a hike or a cut, over the past nine years or so), September looks like the first meeting where a Fed cut is expected.
Technical Take:
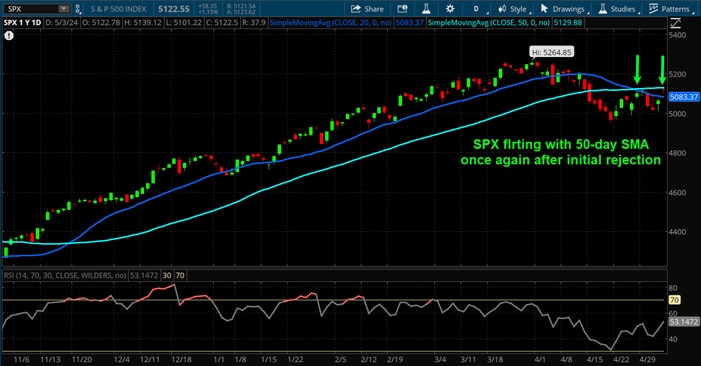
S&P 500 Index (SPX + 58 to 5,122)
If you had asked me about where the SPX technicals stand on Wednesday, I would have said they look bearish since the index appeared to be getting hit with selling pressure after attempting to rally back towards the 50-day Simple Moving Average (SMA). Technically speaking, when the underlying drops below a longer-term moving average and then rallies from the underside back up to that indicator and gets rejected, its typically viewed as a bearish confirmation and called a "pullback." With this morning's jump in the SPX, the index has moved back up to just below the 50-day SMA (currently 5,129), which has me wondering, "will there be another rejection?" Seeing where we close today would be helpful to know, but I'm writing this around 1:00 p.m. EDT and don't have that luxury. If the SPX can close above this indicator, or if we can close near the highs of the day, I would consider that to be bullish price action. Setting that aside, it feels like this morning's jobs reports, along with a meaningful drop in bond yields (10-year yields hitting the lowest levels since April 11th), has shifted near-term sentiment in favor in the bulls. Near-term technical translation: slightly bullish.
Source: ThinkorSwim trading platform
Past performance is no guarantee of future results.
Nasdaq Composite Index ($COMP + 302 to 16,142)
Today's near 2% jump in the Nasdaq Composite has placed the index above its 50-day SMA (currently 16,057). This puts the $COMP in a relatively more bullish technical position than the SPX. The index is also roughly ~2.5% away from its all-time intraday high of 16,538 which was hit back on March 21st. Near-term technical translation: slightly bullish.

Source: ThinkorSwim trading platform
Past performance is no guarantee of future results.
Market Breadth:
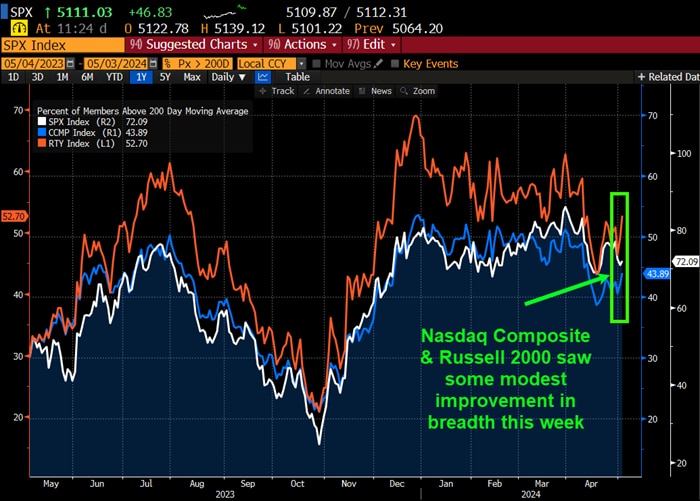
The Bloomberg chart below shows the current percentage of members within the S&P 500 (SPX), Nasdaq Composite (CCMP) & Russell 2000 (RTY) that are trading above their respective 200-day Simple Moving Averages. This week we saw a modest expansion in breadth in the Nasdaq Composite and Russell 2000, which was nearly entirely driven by this morning's soft jobs report and subsequent bounce in those indices today. Compared to last Friday, the SPX (white line) breadth moved down to 72.09% from 75.90%, the COMPX (blue line) increased to 43.89% from 41.31%, and the RUT (red line) improved to 52.70% from 48.65%.
Source: Bloomberg L.P.
Market breadth attempts to capture individual stock participation within an overall index, which can help convey underlying strength or weakness of a move or trend. Typically, broader participation suggests healthy investor sentiment and supportive technicals. There are many data points to help convey market breadth, such as advancing vs. declining issues, percentage of stocks within an index that are above or below a longer-term moving average, or new highs vs. new lows.
This Week's Notable 52-week Highs (125 today): AudioEye Inc. (AEYE + $0.74 to $18.11), Carvana Co. (CVNA + $2.13 to $118.63), Delta Air Lines Inc. (DAL + $0.46 to $51.49), Garmin Ltd. (GRMN + $0.69 to $166.02), Impinj Inc. (PI + $1.95 to $161.68), Qualcomm Inc. (QCOM - $0.78 to $179.32), Thompson Reuters Corp. (TRI + $2.07 to $165.03)
This Week's Notable 52-week Lows (13 today): APA Corp. (APA + $0.38 to $29.56), Bristol-Myers Squibb Company (BMY + $0.37 to $44.07), CVS Corp. (CVS - $0.13 to $55.03), Etsy Inc. (ETSY + $1.22 to $60.49), Jack in the Box Inc. (JACK + $1.08 to $55.73), Mosaic Co. (MOS + $0.73 to $29.14), Verisign Inc. (VRSN + $0.11 to $168.45), Wolfspeed Inc. (WOLF + $1.46 to $25.02)