Will Services Offset Weakness in Manufacturing?
 By
By

Key Points
Economic output can be split into manufacturing and services, but it isn’t 50/50. Services make up more of the economy, jobs, and the stock market.
The time has come to focus on services data to get a sense of the overall economic picture. Services are picking up as manufacturing is slowing due to supply problems.
The stock market is treating results from service companies differently than those in manufacturing, in this earnings season thus far. This could pose a risk to stocks more than to the economy or jobs, should supply problems deepen or linger longer than expected.
All the news about the threat to the economy from supply problems and soaring input costs for manufacturers, it would be natural to think the world was solely dependent upon making stuff. But, in fact, it is more dependent on doing stuff—and doing stuff is going great.
World of services
Economists split the world’s output (GDP) into two main categories: manufacturing and services (agriculture is now a distant third category). Today, the largest share of the world’s output is services. This hasn’t always been the case. For much of recorded history agriculture was dominant. Manufacturing became dominant with the Industrial Revolution, and only recently has services come to be the leading producer of economic activity. Reflecting the global economy, stocks in services industries make up a larger share of the world’s stock market value than those in manufacturing, as measured by the MSCI World Index.
Services’ share of world: GDP, jobs and stock market
World stock market represented by MSCI World Index.
Source: Charles Schwab, World Bank and Factset data as of 10/22/2021.
Ask anyone where the world’s goods are manufactured, and they are likely to answer “China.” However, even China’s economy has seen services account for more than 50% of GDP in recent years. As output has shifted, so too, have jobs. In 2019, employment in services surpassed 50% of total world employment for the first time.
Rapid rise: most workers now have service jobs
Source: Charles Schwab, World Bank data as of 10/22/2021.
Blind spot
While services dominate the economy, jobs, and the stock market, they are almost a blind spot to investors when it comes to data. About 80% of monthly economic data is about manufacturing with comparatively little for services. Why the relative blind spot for data on services? Manufacturing output is easier to measure, reflected in the counting of physical goods’ transfers. The definition of a service, a transaction in which no physical goods are transferred from the seller to the buyer, is by nature harder to measure and tends to be more qualitative. Services include healthcare, law, finance, entertainment, education, and hospitality.
Overweighting manufacturing data
Share of October world economic data releases associated with service and manufacturing.
Source: Charles Schwab, Bloomberg data as of 10/23/2021.
The relative scarcity of services data can be overcome with a little creativity. For example, trends in demand for manufactured goods are often a good indicator of demand for services. But that hasn’t always been the case and it may not be the case right now given the supply chain problems plaguing manufacturing. If there was ever a time to focus more on service data to get a sense of the overall economic picture, that time may be now.
Looking up
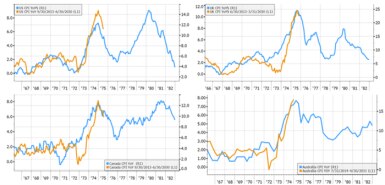
Fortunately, the data on services is positive. Friday’s October flash services purchasing managers index (PMI) reports, the most timely readings of services in major economies around the world, tells us that services are thriving as the fourth quarter gets underway. This contrasts with the manufacturing PMI reports that showed slowing momentum, shortages holding back growth and pushing up inflation.
Specifically, the PMI reports showed an acceleration of economic activity in services, lifting overall economic output in October. For example, the overall economy flash composite (manufacturing and services combined) PMIs for both Japan and Australia rose in October to above 50, the level that marks the line between growth and contraction. The services PMI in Australia jumped from 45.5 to 52.0 and in Japan from 47.8 to 50.7. This helped to lift the average composite PMI among major nations with flash readings (the United States, Germany, France, Japan, Australia, and United Kingdom) above the 20-year average, even as the manufacturing PMI fell in the United States, Germany and France.
More good news from services is the pick-up in the pace of hiring. In the Eurozone, the employment component of the services PMI continues to rise and reached its highest level since July 2007, even though the employment component of the manufacturing PMI only managed to stabilize after falling from its recent high of a few months ago. The latest reading points to overall job growth in the fourth quarter above 2% in Europe, the fastest pace in more than a decade, as you can see in the chart below.
PMI points to fastest job growth in more than a decade
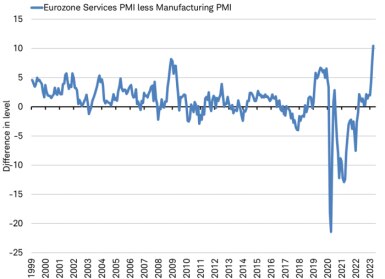
Source: Charles Schwab, Bloomberg data as of 10/23/2021.
With services surprising on the upside, lifting overall economic output and jobs, the overall economy may continue to post solid growth even if manufacturing slows due to lingering supply constraints and rising costs.
Earnings
There is one area where services don’t pull their weight: corporate earnings. In the MSCI World Index, 49% of the companies in the MSCI World Index with earnings reports or estimates for the third quarter are in services and are expected to contribute 38% of the earnings growth from a year ago, leaving 51% in manufacturing estimated to contribute to 62% of the earnings growth.
More notably however, the stock market is treating results from service companies differently than those in manufacturing so far this earnings season, with 246 of the nearly 1600 companies in the index having reported third quarter results. Overall results are similarly strong for both categories: 124 of the 143 service companies reported earnings that exceeded analysts’ estimates (87%), while 86 of the 104 manufacturing companies reported better than expected results (83%). But, more than half (57%) of the manufacturing companies that exceeded estimates saw their stocks decline on the day they reported, while services companies that exceeded estimates generally saw their stocks rise. This uncoupling suggests investors may be increasingly concerned about manufacturing companies’ ability to deliver on expectations in the fourth quarter and beyond. Overall, with stocks rising on most days so far during the earnings reporting season and the market favoring results from services companies, investors seem to be satisfied that improvement in services can sustain overall earnings growth despite its smaller contribution.
Stocks fall for most manufacturing firms beating expectations
Of 246 companies in MSCI World Index that have reported third quarter results broken down by service and manufacturing companies and whether they beat analysts’ earnings estimates or missed them. Company counts are reflected in bar labels. Source: Charles Schwab, Factset data as of 10/22/2021.
Takeaway
It can be easy to forget that services are more important to the global economy than manufacturing. The latest data shows services are sustaining the economic, jobs, and earnings outlook despite a slowdown in manufacturing due to well-publicized supply problems. Yet, corporate earnings are more dependent upon manufacturing companies and if the slowdown were to deepen or linger longer than expected, investors may grow more cautious on their outlook for manufacturing, posing a risk to stocks more than to the economy or jobs.
What You Can Do Next
Follow Jeffrey Kleintop on Twitter: @JeffreyKleintop.
Explore Schwab’s views on other international topics.
Talk to us about the services that are right for you. Call us at 800-355-2162, visit a branch, find a consultant, or open an account online.