Looking to the Futures
Soybean Oil Rallies to Eighteen-Month High

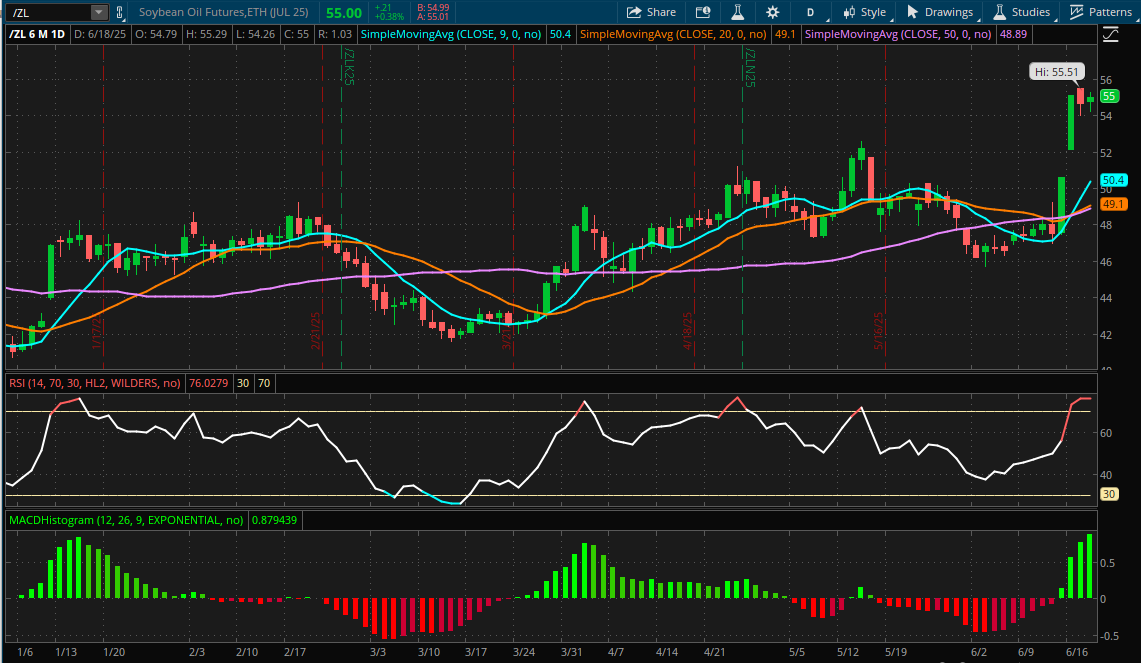
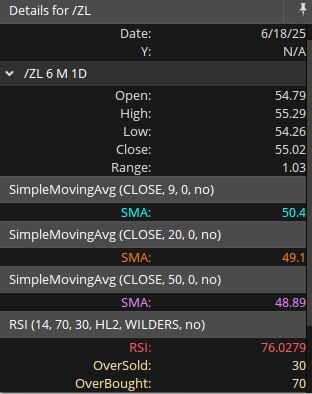
Soybean oil futures (/ZL) reached 55.51 cents per pound Monday night before retreating. The trade, which occurred at the open of Tuesday's session, was a continuation of a trend that started Friday morning. Thursday saw some volatility, trading between 47.00 and 49.22 on heavy volume. That was a relative calm before the storm however, since the contract jumped three cents, the daily limit from prior settlement, after the daily pause ended at 9:30am ET on Friday.
Part of the run-up in prices was due to Israel's attacks on Iran. Crude oil (/CL) spiked by about $9 or 13% on the news and heating oil (/HO) jumped nearly 16 cents, roughly 7%. Soybean oil gained about a penny, roughly 2% following the strikes. The main reason for the big rally, however, was a release from the EPA on Friday morning. The agency raised the Renewable Vehicle Obligations target by 67% from 2025 to 5.61 billion gallons for 2026. A further increase to 5.86 billion gallons has been proposed for 2027. The mandates require significantly more biodiesel in domestic fuel production.
In response to the mandate, front-month soybean oil futures for July delivery jumped to the three-cent daily limit at the end of the morning pause on Friday on heavy volume. In the first minute of trading after the announcement, 10,477 contracts traded. That represents over 14% of average daily volume for the contract. The contract spent all but the first 20 minutes trading on Friday locked limit-up at 50.61. After Friday's move, the CME expanded the daily limit to 4.5 cents. It opened Sunday night about 1.5 cents higher, then rallied to the expanded limit of 55.11, ending limit-up for the last half hour of trading on Monday. Following that, the contract had a busy first minute of trading for the Tuesday session, with a trade at 55.51 marking a level last seen in November 2023.
In addition to the front-month contract, all contracts with significant volume ended limit-up on Friday. Most made further gains on Monday thanks to the expanded price limits. Every contract through July 2026 (/ZLN26) finished Friday limit-up! It all makes sense considering the nature of the increased demand. It will come through government mandates that would require an expansion of biodiesel production capacity if implemented. The EIA's most recent U.S. Renewable Diesel Fuel and Other Biofuels Plant Production Capacity report estimated annual renewable diesel and biodiesel production capacity at 4.33 billion gallons in 2024. The 2025 report will be released in August.
While soybean oil futures were having a moment, soybean meal futures (/ZM) dropped sharply. The front-month contract, currently set for July, dropped to a multi-year low, reaching $284.10 per ton. An increasing amount of soybean oil production would provide significantly more soybean meal as a byproduct. Soybeans rallied in sympathy with oil, jumping about 15 cents to 1061.75 cents per bushel following the morning halt. With soybeans rallying less than oil and meal down, the crush spread ( 11*/ZL+2.2*/ZM-/ZS , chartable in thinkorswim)has processor profits at the highest level since November.
Technicals
The recent surge pushed the RSI above the overbought level of 76. It also led to a three-way cross of the 9-, 20- and 50-day SMAs on Monday. The move also sent the contract beyond the upper Bollinger Band. The move also represented a breakout from the range of 46-51 where the contract had spent most of the last two months.
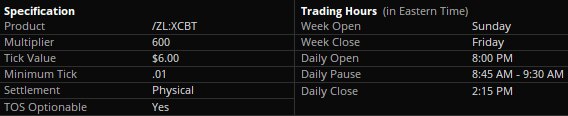
Contract Specifications
Economic Calendar
Building Permits 8:30 AM ET
EIA Crude Oil Inventories 10:30 AM ET
FOMC Rate Decision 2:00 PM ET
Housing Starts 8:30 AM ET
MBA Mortgage Applications Index 7:00 AM ET
Net Long-Term TIC Flows 4:00 PM ET
New Products
New Futures contracts are live! Please be aware that the following products are now available to trade with an approved futures account on all thinkorswim platforms:
- 1 OZ Gold (/1OZ)
- Solana (/SOL)
- Micro Solana (/MSL)
Go here to explore the wide variety of futures markets available for trading through Charles Schwab Futures and Forex LLC.