Stocks Helped Early by Weak Oil, But Chips Down

Published as of: August 3, 2026, 9:15 a.m. ET
Listen to this update
Listen here or subscribe to the Schwab Market Update in your favorite podcast app.
| The markets | Last price | Change | % change |
|---|---|---|---|
| S&P 500® Index | 7,489.72 | +52.09 | +0.70% |
| Dow Jones Industrial Average® | 52,485.03 | +276.97 | +0.53% |
| Nasdaq Composite® | 25,373.85 | +251.68 | +1.00% |
| 10-year Treasury yield | 4.68% | -0.06 | -- |
| U.S. Dollar Index | 99.81 | -0.10 | -0.10% |
| Cboe Volatility Index® | 15.94 | -0.05 | -0.31% |
| WTI Crude Oil | $79.01 | -$5.64 | -6.65% |
| Bitcoin | $62,880 | -$250 | -0.40% |
Help us make the Schwab Market Update better—take our 3-minute survey.
(Monday market open) August began with a mild rally led not by the usual chip suspects but instead by software and consumer names. This followed President Trump's post that he had called off an attack on Iran thanks to progress in negotiations, though market participants have heard this before and Iran denied it's in talks. Crude retreated, however, and Treasury yields fell after Japan and the U.S. announced a joint intervention designed to lift the slumping yen.
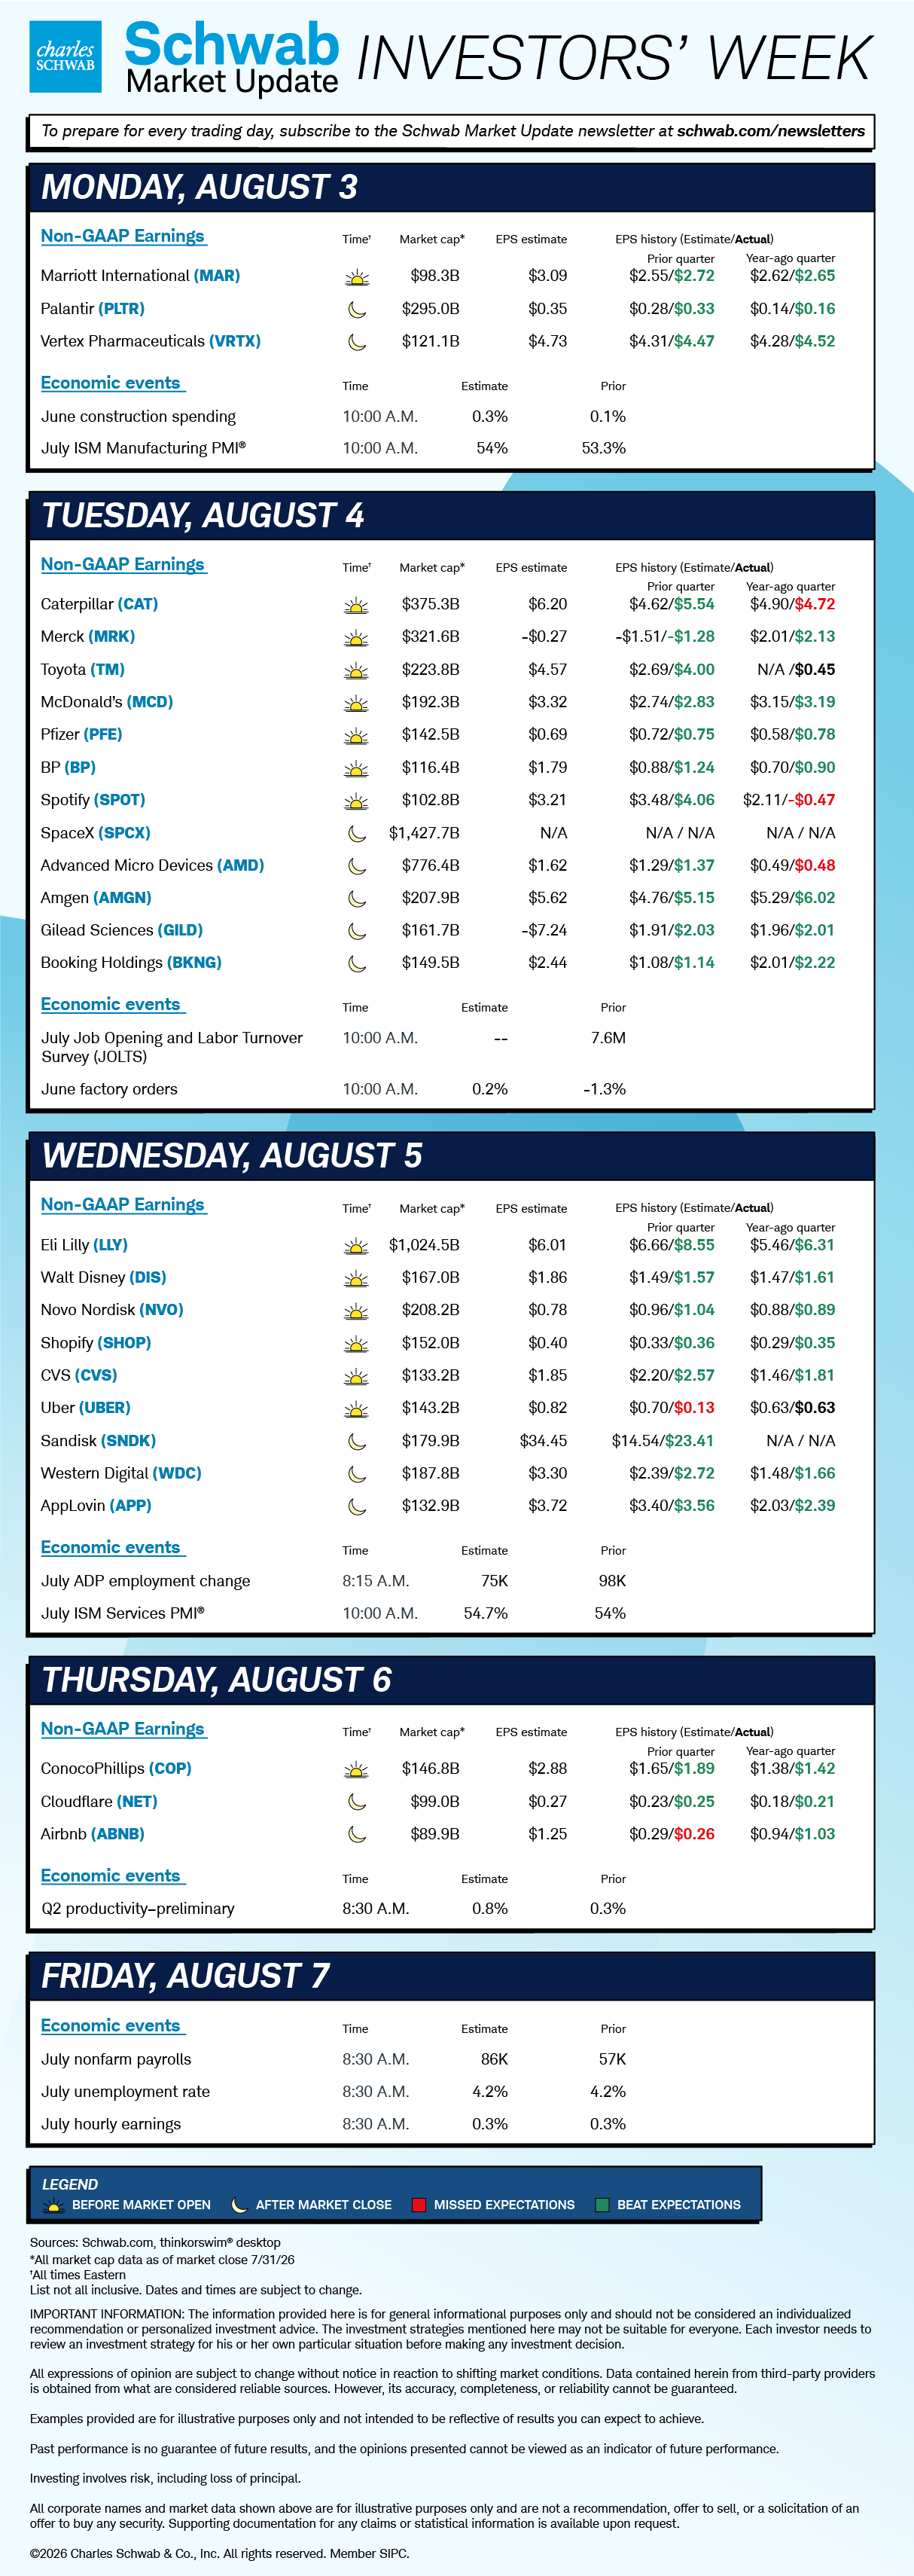
Monday looks relatively quiet on the earnings and economic front after last week's headliners, though Palantir (PLTR) is a highlight after the close. In economic data today, the July ISM Manufacturing PMI® is expected to slip to 53% from 53.3% in June. A reading above 50 depicts expansion. Later this week, SpaceX (SPCX), Advanced Micro Devices (AMD), and Sandisk (SNDK), among many others, are scheduled to report, and Federal Reserve speakers pepper the calendar. July nonfarm payrolls data due Friday is expected to show 86,000 new jobs, up from 57,000 in June.
Stocks rose Friday, with the Nasdaq jumping 1% to end a volatile week and month with two days of strong gains. Amazon (AMZN) surged more than 15% on cloud-computing strength. Apple (AAPL), however, lost more than 7% after providing weak guidance for the current quarter due to a global memory crunch. Treasury yields reached a 19-year peak for the 30-year bond. On a happier note, results from Amazon and Microsoft (MSFT) offered "encouraging evidence of traction around AI monetization," said Nathan Peterson, director of derivatives research and strategy at the Schwab Center for Financial Research (SCFR). "The money flow has poured back into this space over the last two days."
To get the Schwab Market Update in your inbox every morning, subscribe on Schwab.com.
Three things to watch
- When should the Fed stop looking through supply shocks? Oil prices have been a wild card for the Fed. Policymakers generally "look through" such supply shocks—until they can't. The trick is deciding when they can't. For at least one dissenter at this week's Fed meeting, that time may be now. In a statement Friday, Minneapolis Fed President Neel Kashkari said he increasingly believes that monetary policy has a role to play in addressing supply shocks, especially a series of supply shocks such as the one seen over the past six years: COVID-19 supply chain disruptions, the war in Ukraine, U.S. tariffs, and the Iran war. For comparison, he pointed to the 1970s, when the Fed raised rates in response to a series of shocks. "If inflation remains elevated, in my view, a potential series of small policy moves would be better than waiting and eventually concluding that even bolder actions were necessary," he said.
- Malaise for the American consumer? One notable number released alongside Thursday's gross domestic product (GDP) estimate is the personal saving rate—saving as a percentage of disposable personal income—which hit 2.7% in June. While still in positive territory, that's down from 2.8% in May, 3% in April, and 3.5% in March, marking six straight months of declines and landing well below the historical average of nearly 8.4%. Meanwhile, spending growth has outpaced income growth in the past five months, and 90-plus day delinquencies on credit card balances are near a 15-year high at 13.1%. This could be a sign that the K-shaped economy is still alive and well, as the wealthiest Americans continue to account for the lion's share of consumer spending, potentially masking struggles being felt by the average consumer as prices continue to rise. June job openings data tomorrow morning could begin to provide clues into consumer sentiment. Consensus is 7.45 million.
- Intervention to support yen follows past tries: Treasury yields eased and the dollar fell slightly early today after the U.S. and Japan announced they'd worked together to support the slumping yen. Before this joint effort—the first since 1998 to feature just the U.S. and Japan—worries Japan might sell Treasuries to finance yen purchases were among several factors sending yields up sharply over the last month. U.S. yields fell today in part on the intervention but also due to cheaper oil. Past efforts to support the yen, including solo ones by Japan in the last few years, generally fizzled as Japan's heavy debt and low interest rates kept the currency weak. A soft yen can make products from that country cheaper for buyers abroad, but also contributes to dollar strength that raises costs for importers of U.S. goods.
On the move
- Palantir added 2.6% in early trading ahead of its earnings due after the close. Last time out, the software firm impressed investors with better-than-expected earnings and an 85% annual revenue rise. Palantir also raised guidance. Analysts expect $0.35 for second quarter earnings per share and $1.8 billion in revenue.
- Other software names also led early gains, with ServiceNow (NOW), Palo Alto Networks (PANW), and Salesforce (CRM) among those up 3% or more before the open. Chip stocks, which often move opposite of software, generally fell.
- SK Hynix (SKHY), Micron (MU), and Sandisk all lost 4% or more early as memory chip stocks took the brunt of the blow among semiconductor names ahead of earnings later this week from Sandisk and Western Digital (WDC) and concerns over Chinese memory competition.
- The PHLX Semiconductor Index (SOX) fell more than 20% in July but is still up nearly 60% year to date.
- Alibaba (BABA) rose 4% early after the firm unveiled its latest AI model as Chinese companies try to close the AI gap with the U.S.
- AstraZeneca (AZN) fell more than 4% in early trading and Bristol-Myers Squibb (BMY) jumped nearly 5% after the Financial Times reported that the two pharmaceutical firms held early-stage discussions about a potential combination. A deal would create a firm with a combined value of nearly $400 billion.
- Circle Internet Group (CRCL) fell 6% after getting downgraded by Morgan Stanley to underweight from equal weight, citing margin concerns, among other worries.
- Marriott International (MAR) fell 3.5% after reporting quarterly revenue that missed analysts' consensus and guiding for third quarter earnings below the consensus estimate as well.
- Fed rate hike odds for September reached almost 63% this morning, down from 67% on Friday, according to the CME FedWatch Tool.
- Second quarter blended S&P 500 earnings per share growth (including companies reporting and estimates of those to come) is tracking at 47.4%, FactSet said Friday. About 61% of S&P 500 companies have reported to date, with 86% beating consensus on EPS and 77% surpassing consensus on revenue.
More insights from Schwab

A guide to IRAs: Whether you're opening your first individual retirement account (IRA) or comparing retirement account options, check out the new episode of Financial Decoder is a for some a practical explanations about how IRAs work, limits, advantages, and more.
Potential tax consequences from overtrading: Learn how frequent trading in taxable accounts, particularly when it stems from trying to beat or time the market, may significantly reduce after-tax returns.
Chart of the day
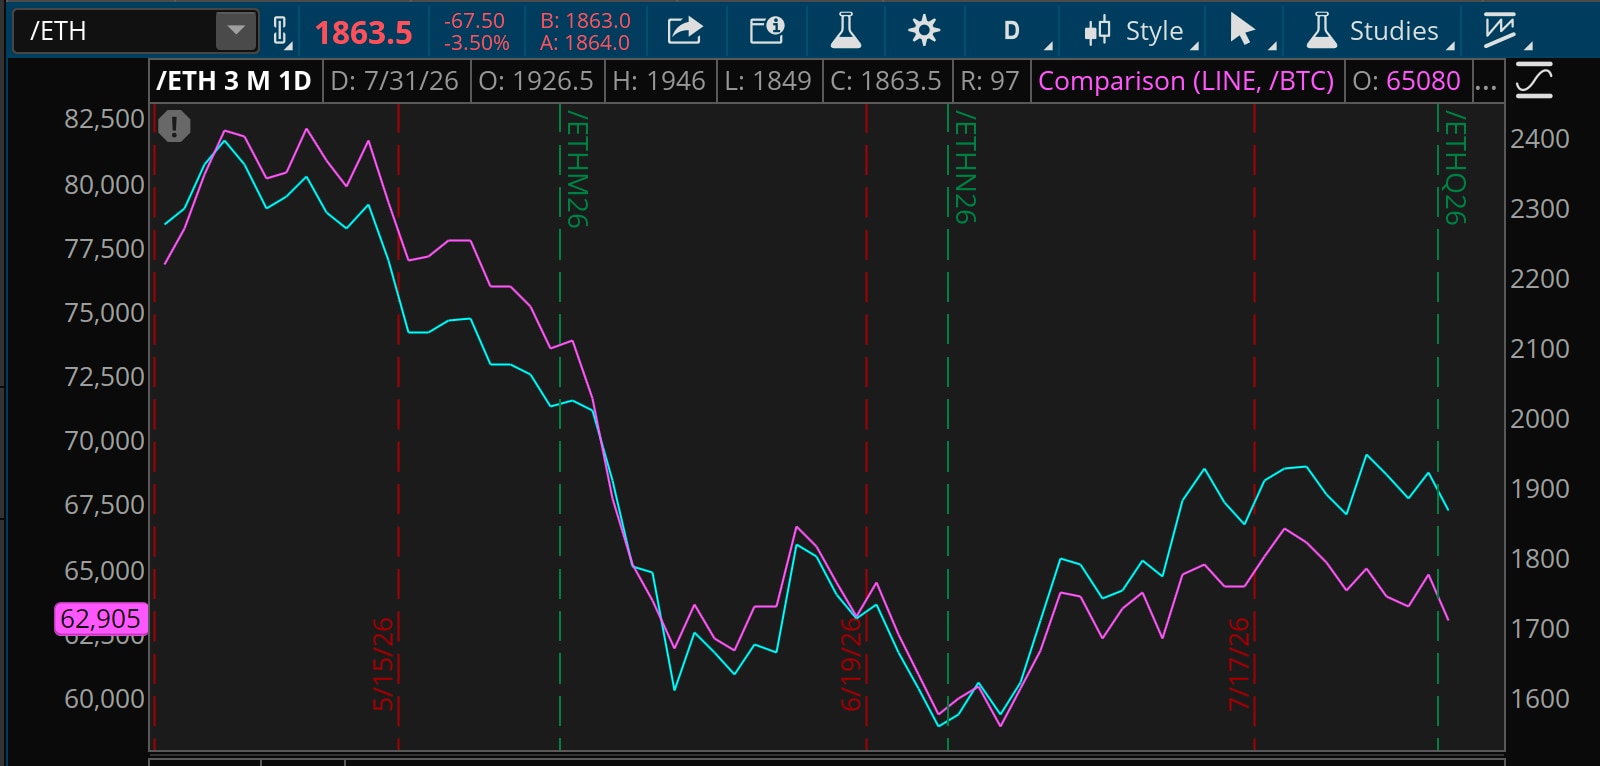
Data source: CME Group. Chart source: thinkorswim® platform.
Past performance is no guarantee of future results.
For illustrative purposes only.
Ether futures (/ETH–blue line) have started to outperform their larger counterpart, bitcoin futures (/BTC–purple line) in the past month or so. Jim Ferraioli, director of digital currencies research and strategy at the Schwab Center for Financial Research, said this recent shift could lead crypto watchers to speculate about the start of alt season. "In bear market recoveries, altcoins have staged short-term rallies where they have outperformed bitcoin. That may be what is happening with ether now," he noted.
The week ahead