2026 Outlook: Treasury Bonds and Fixed Income

Key takeaways
- We expect solid returns in fixed income markets in 2026, driven by central bank rate cuts in response to a weakening labor market.
- However, the bulk of returns will likely come from coupon income rather than price appreciation, as resilient economic growth and persistent inflation pressures may limit the drop in yields.
- The yield curve likely will remain steep due to the prospect of increasing supply in government, municipal and corporate bonds.
- Fixed income investors should consider focusing on high-quality-credit issuers and an intermediate-term duration, on average. Treasury Inflation-Protected Securities (TIPS) and municipal bonds are potential areas of opportunity.
Carried away
So far 2025 has been a good year in the fixed income markets. Every subcategory we track has posted positive returns year to date, with some in double digits. The combination of starting yields near 5% for investment-grade intermediate-term bonds1 and rate cuts by major central banks helped propel the markets higher.
Fixed income asset class total returns
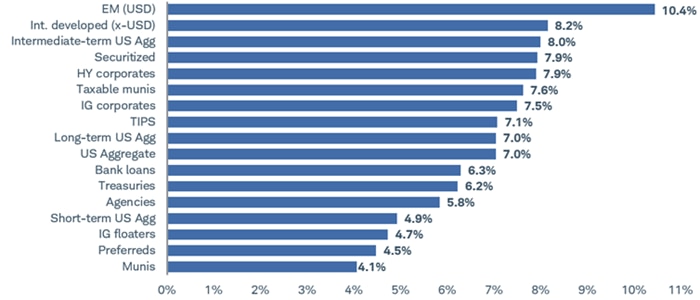
Source: Source: Bloomberg. Total returns from 12/31/2024 through 12/1/2025.
Indexes representing the investment types are: EM (USD) = Bloomberg Emerging Markets USD Aggregate Bond Index; Intermediate-term US Agg = Bloomberg U.S. Aggregate 5-7 Years Bond Index; Taxable munis = Bloomberg Municipal Index Taxable Bonds; Securitized = Bloomberg US Securitized Index; Int. developed (x-USD) = Bloomberg Global Aggregate ex USD Bond Index; Long-term US Agg = Bloomberg U.S. Aggregate 10+ Years Bond Index; HY corporates = Bloomberg US High Yield Very Liquid (VLI) Index; IG Corporates = Bloomberg U.S. Corporate Bond Index; US Aggregate = Bloomberg U.S. Aggregate Index; TIPS = Bloomberg US Treasury Inflation Notes Total Return (TR) Index; Treasuries = Bloomberg U.S. Treasury Index; Bank loans = Morningstar LSTA US Leveraged Loan 100 Index; Agencies = Bloomberg U.S. Agency Bond Total Return Index; Short-term US Agg = Bloomberg U.S. Aggregate 1-3Years Bond Index; IG floaters = Bloomberg US Floating Rate Note Index; Preferreds = ICE BofA Fixed Rate Preferred Securities Index; Munis = Bloomberg US Municipal Bond Index. Total returns assume reinvestment of interest and capital gains. Indexes are unmanaged, do not incur management fees, costs, and expenses and cannot be invested in directly. Past performance is no guarantee of future results.
We expect 2026 to be another good year for fixed income investors. However, yields that are lower than where they were a year ago and less room for rate cuts by central banks likely will mean less-robust returns. Nonetheless, a bias toward easing by major central banks, positive real interest rates (yields adjusted for inflation) and steepening yield curves create a good backdrop for bond investors.
Federal Reserve outlook
We expect the Federal Reserve to lower the target range for the federal funds rate to somewhere in the 3.0% to 3.5% range over the next year, implying two to three additional 25-basis-point rate cuts. A weakening trend in the labor market is the major factor driving the Fed to ease policy given that inflation has held above the Fed's 2% target for more than four years. The sharp slowdown in hiring over the past few months and rise in the unemployment rate are raising concerns among some Fed members about a slowdown in the labor market.
Nonfarm payroll gains have slowed
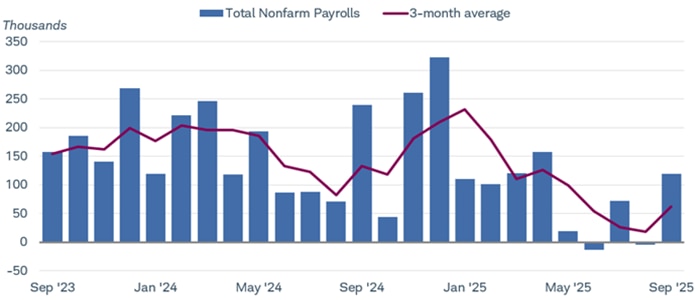
Source: Bloomberg. Monthly data from 9/30/2023 to 9/30/2025, which is the latest data available.
U.S. Employees on Nonfarm Payrolls, Total, MoM, Net Change SA (NFP TCH Index).
However, while hiring has slowed, the current unemployment rate, at 4.4% as of September 2025, is historically low and close to what has generally been considered full employment by many economists. Moreover, average hourly earnings were rising at a 3.8% year-over-year pace in September, according to the Bureau of Labor Statistics, which is higher than the pre-pandemic average.
Overall, the economy looks likely to remain resilient and inflation should persist near 3%, which is significantly above the Fed's 2% target. As we look into 2026, gross domestic product (GDP) growth is likely to remain supported by fiscal stimulus coming from the One Big Beautiful Bill Act, as well as by modestly easier financial conditions courtesy of recent Fed rate cuts. The tax cuts implemented by Congress tend to favor higher-income consumers and corporations, which should keep the economy growing at a rate slightly above the long-term trend of about 2% to 2.5%. Consequently, the Fed doesn't appear to have much room to lower the policy rate. We believe 3% is likely to be a floor.
Inflation remains above the Fed's 2% target
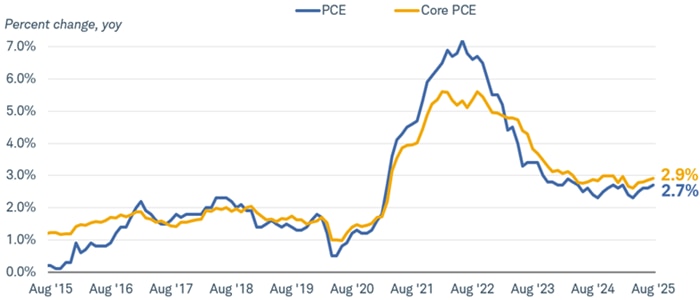
Source: Bloomberg.
PCE: Personal Consumption Expenditures Price Index (PCE DEFY Index). Core PCE: Personal Consumption Expenditures: All Items Less Food & Energy (PCE CYOY Index), percent change, year over year. Monthly data from 8/31/2015 to 8/31/2025.
Yield curve is likely to steepen
We expect the trend toward yield-curve steepening will continue. As the Fed lowers short-term interest rates in response to labor market weakness, intermediate- and long-term rates are likely to lag behind on inflation and supply concerns. Cutting rates with inflation above target risks stoking future inflation. That appears to be a risk that the Fed is willing to run given that inflation expectations are reasonably well contained.
The yield spread between two- and 10-year Treasury yields has widened
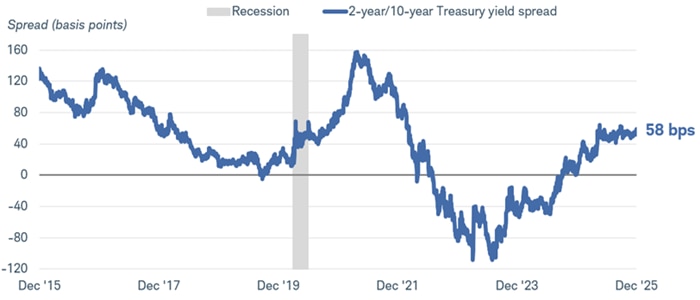
Source: Bloomberg. Daily data from 12/2/2015 to 12/2/2025.
Market Matrix US Sell 2 Year & Buy 10 Year Bond Yield Spread (USCY2Y10 INDEX). The rates are comprised of Market Matrix U.S. Generic spread rates. This spread is a calculated Bloomberg yield spread that replicates selling the current 2-year U.S. Treasury Note and buying the current 10-year U.S. Treasury Note, then factoring the differences by 100. Shading indicates past recession. A basis point is a unit of measurement equal to one-hundredth of one percent, or 0.01%. Past performance is no guarantee of future results.
However, the prospect of an increasing supply of bonds is likely to keep long-term yields elevated despite Fed policy easing. Large and rising fiscal deficits and increasing issuance of U.S. Treasuries—as well as debt issuance in other major economies—means that more and more buyers need to step up to help fund government spending. Ten-year Treasury yields may not fall much below the 3.75% level even as the Fed cuts interest rates and there is a risk that they will move back up toward 4.5% at times.
Meanwhile, corporate and municipal bond issuance likely will increase due to ongoing investment in technology and tax incentives. Taken together, the rising supply of bonds will likely mean yields remain high to attract more buyers.
Risks abound
There are plenty of risks to our outlook. In the labor market, recent softness in hiring could prove temporary or simply reflect a shrinking pool of labor. If wage growth remains healthy, the Fed might hold off on more rate cuts as the labor market would be in balance. Inflation could surprise on the upside, eroding the case for rate cuts and potentially sending yields higher.
Downside surprises for yields include the potential for a recession to unfold due to a reduction in investor risk appetite that sends the stock market lower and reduces investment and economic growth.
Policy uncertainty is likely to continue. The unknowns around tariffs and trade policy appear to be largely behind us, but there is the potential for another standoff over budget issues as Congress remains deeply divided.
Finally, major developed market countries are facing increasing challenges due to high and rising deficits. Investor confidence in managing budgets is being tested. In some countries it has led to investor pushback and higher bond yields. Loss of confidence could manifest itself in bouts of volatility.
For investors: Base case and potential opportunities
Our "base-case" (the most likely or expected outcome) outlook calls for two to three rate cuts by the Fed in 2026 amid steady economic growth and ongoing inflation pressures. The outcome is likely to mean a steepening yield curve. In that environment, we favor keeping average duration in portfolios in the intermediate term (about five to 10 years) and staying in predominantly investment-grade-credit-quality bonds. The Bloomberg U.S. Aggregate Bond Index is a close proxy for that type of portfolio, with a yield-to-worst (the lowest return an investor can receive on a callable bond barring default) of 4.3% and average duration of six years as of December 2, 2025.
For investors in passive strategies, returns are likely to be in line with starting yields or slightly higher in our scenario. A shallower path of rate cuts or budget concerns could pull bond yields up and prices down, however, potentially resulting in lower returns.
In actively managed portfolios, a steep yield curve can allow for additional return through "carry" and "roll" strategies. Carry refers to the ability to sell a short-term lower-yielding bond and invest in intermediate- to long-term bonds, earning the difference in yield. Roll refers to managing a portfolio's duration to add capital gains. Carry strategies carry the risk of greater volatility if borrowing costs increase, while roll strategies can underperform if the slope of the yield curve doesn't evolve as expected. Investing in any sort of active strategy poses the risk that performance can differ—up or down—from the underlying benchmarks depending on the decisions of the portfolio managers.
For investors concerned about inflation, we believe TIPS are attractive. They have real (that is, inflation-adjusted) interest rates of 1.25% to 2.0%. That means investors will receive that yield plus the inflation rate over the life of the bond if held to maturity.
Municipal bonds can make sense for investors in higher tax brackets. They currently offer a good balance of attractive yields after considering taxes and stable credit quality. Many municipalities have built up their savings and are generally well positioned in case of an economic slowdown.
Overall, we expect 2026 to be another good year of returns for bond investors, but the range of potential outcomes remains wide. We continue to favor a middle-ground strategy—up in quality and intermediate-term average duration—that may help mitigate some of the risks while allowing for potentially attractive returns.
1 Source: Bloomberg U.S. Aggregate Bond Index, as of 12/31/2024.