2025 Treasury Bonds and Fixed Income Outlook

It looks like another bumpy ride is in store for fixed income investors in 2025, with a wide range of potential outcomes. Treasury yields have been on a roller coaster in 2024. For much of the year, the soft-landing scenario of moderate growth and falling inflation amid low unemployment drove bond yields lower, but upward revisions to growth estimates and concerns about policy proposals that could boost inflation in 2025 led to a rebound.
Consequently, we are taking a cautious approach to duration and credit risk. We suggest holding a benchmark duration or lower as we enter the new year. We also continue to favor allocating to higher-credit-quality bonds.
Despite our caution, we also recognize that volatility can translate into opportunities. Higher yields potentially can provide investors with more income and stronger returns in the long run. We expect to find areas in the fixed income markets that can deliver solid returns in 2025.
Inflation risks are tilting higher
The trifecta of proposed policy proposals from the incoming administration—tariffs, limits on immigration, and tax cuts—if enacted, could drive inflation higher and widen the federal budget deficit.
As a result, investors are starting to demand higher yields to compensate for the risk of holding long-term Treasuries. These policies could also limit the Federal Reserve's scope for lowering short-term interest rates. It is too early to know what proposals will be enacted—if any—but they could tilt the risks toward higher inflation and potentially lead to higher yields.
Yields for two-year and 10-year Treasury bonds have risen

Source: Bloomberg, daily data as of 11/26/2024.
U.S. Generic 2-year Treasury Yield (USGG2YR INDEX) and U.S. Generic 10-year Treasury Yield (USGG10YR INDEX). Past performance is no guarantee of future results.
Inflation is fundamentally an imbalance between supply and demand. It's often referred to as "too much money chasing too few goods." Since the pandemic spike in mid-2022, inflation has been falling and is nearing the Federal Reserve's 2% target. Supply and demand for goods and services have largely stabilized, leaving the deflator for personal consumption expenditures (PCE)—the Federal Reserve's preferred inflation gauge—in the 2.5% region, even as the economy's growth rate has remained solid at a 3% pace. However, the core PCE rate, which excludes volatile food and energy prices, has stalled at a slightly higher level due to the "stickiness" of housing costs.
Inflation has declined

Source: Bloomberg, monthly data as of 9/30/2024.
PCE: Personal Consumption Expenditures Price Index (PCE DEFY Index), Core PCE: Personal Consumption Expenditures: All Items Less Food & Energy (PCE CYOY Index), percent change, year over year.
As a result of inflation's decline, the Federal Reserve recently began cutting its benchmark federal funds rate, the interest rate at which banks borrow from each other overnight. The Federal Open Market Committee (FOMC) cut the rate by 50 basis points, or 0.5%, at its September meeting and 25 basis points at its November meeting.
At the September meeting, the Fed's quarterly Summary of Economic Projections (including its closely followed "dot plot") indicated that the federal funds rate would be lowered steadily in 2025 and early 2026, ending in a range of 2.75% to 3.0%.
The Fed's projections and the market's expectations have diverged

Source: Bloomberg, data as of 11/13/2024.
Yellow line shows FOMC estimate for meeting date 9/18/2024. Blue line shows WIRP Implied Overnight Rate for the US - Futures Model. World Interest Rate Probability (WIRP) Implied Overnight Rate for the US - Futures Model (US0AFR OCT2025 Index). WIRP Implied Overnight Rate for the U.S. - Futures Model represents the estimated forward rate for the United States using the futures model. This ticker utilizes "virtual ticker" technology to show multiple dimensions of data via a single ticker. By default (without a virtual component added) the ticker always references data for the upcoming meeting of the country under analysis. Once a meeting passes, the ticker then rolls to the next meeting. Past performance is no guarantee of future results. For illustrative purposes only.
We expect members of the Fed to change their projections at the December 17-18 meeting to reflect stronger-than-expected economic growth in recent months, as well as caution about potentially expansive fiscal policies. Fed Chair Jerome Powell has indicated that the Fed won't react to changes in fiscal policy until there is sufficient information to analyze. Nonetheless, as proposals unfold, it is reasonable to assume that the Fed may be more cautious about rate cuts. Meanwhile, the market has already begun to price in fewer rate cuts and a higher end of cycle rate since the election. In the new year, the dot plot will be a key indicator of how the various members of the Fed are viewing the landscape for 2025 and beyond.
Higher tariffs could lead to higher inflation
Trade policy changes could be one factor that upends the Fed's plans for 2025. Tariffs are a potential inflation risk, as they cause import prices to rise. They could end up as a one-time price shock or become an ongoing source of inflation. Companies that import goods pay the tariffs and then pass along as much of that added cost as possible to consumers. On the campaign trail, President-elect Donald Trump proposed broad-based tariffs on imported goods of 10% to 20%, and potentially as high as 60% on goods imported from China. We would expect some of those tariffs to be evaded by China's shifting production or shipments to third-party countries. Nonetheless, much of the cost is likely to end up being paid by U.S. consumers.
Moreover, Trump has advocated weakening the U.S. dollar to boost U.S. export competitiveness, but the proposed policies are likely to make it stronger. A weaker dollar tends to raise the cost of imported goods, as it takes more dollars to pay for those goods. Because the U.S. is a major net importer, a weaker dollar could add to inflation pressures and tighter Fed policy.
Although these are risks, there are factors that could offset the inflationary impact. Tariffs can slow the economy as high prices may curtail demand and investment. Moreover, other countries may retaliate, hurting U.S. exporters. In terms of the dollar, the prospect of tariffs has given it a boost since they are expected to lead to higher inflation and higher interest rates. Weakening the dollar for trade purposes may be hard to achieve.
The dollar is near the top of a multi-year range

Source: Bloomberg. Bloomberg Dollar Spot Index (BBDXY Index). Daily data as of 11/26/2024.
Indexes are unmanaged, do not incur management fees, costs and expenses, and cannot be invested in directly. Past performance is no guarantee of future results.
Limiting immigration could slow economic growth
A second proposal, limiting immigration and possibly widespread deportations, could have a greater long-term impact on the economy than tariffs. It could lead to higher wage costs and slower growth. Over the past few years, the working age population of native-born Americans has declined due to retirements. Immigrants have helped fill the gap, raising the supply of labor. Labor costs, while still higher than pre-pandemic levels, have normalized.
Deportations could reduce the supply of labor by as much as 7% to 8%, which could increase hiring costs, adding to inflation pressures. There were an estimated 11 million undocumented workers in the U.S. in 2022, according to the Pew Research Center.1 In addition, there were 1.3 million adults in the labor force who were children of undocumented immigrants and an estimated 1 million to 2 million waiting for work authorization papers at risk of deportation. With a work force of 168 million in the U.S., removing 12 million to 14 million people would likely create shortages of labor in many industries. Immigrants tend to be highly represented in some sectors such as construction, hospitality and leisure, and agriculture2—areas where costs are passed through quickly to households.
The Employment Cost Index (ECI) shows fluctuating hiring costs

Source: Bloomberg, quarterly data as of 9/30/2024.
Bureau of Labor Statistics Employment Cost Wage Civilian Workers (ECWSCVQQ Index) and Bureau of Labor Statistics Employment Cost Benefits Civilian Workers (ECIPCIVL Index).
Like tariffs, limiting immigration can have a negative impact on growth. A shrinking workforce typically means less output and gross domestic product (GDP) growth. With government obligations to an aging population growing, debt levels to fund Social Security and Medicare could grow relative to the size of the economy.
Tax cuts without spending cuts could boost inflation
A third factor that could potentially boost inflation is tax cuts if not offset by spending cuts. This type of fiscal stimulus at a time when the economy is growing at a healthy pace without a lot of excess capacity could boost demand relative to supply. Much depends on the size of the tax cuts and who benefits the most. The administration has promised widespread spending cuts, but the market view is skeptical that those can be achieved. Most of the federal budget goes to areas that are difficult to trim, such as Social Security, Medicare, veterans' benefits and defense.
A budget bill will take time to pass, but the bond market is likely to remain on edge, particularly at a time when debt and deficit levels are already very high. The prospect of rising deficits could lead investors to demand a higher risk premium to hold long-term Treasuries, known as the "term premium." The term premium has already begun to rise. Expansionary fiscal policy could push it higher.
The term premium for 10-year Treasuries has risen

Source: Bloomberg. Federal Reserve Bank of New York. Monthly data as of 11/22/2024.
The term premium is the compensation that investors require for bearing the risk that short-term Treasury yields do not evolve as they expected. The term premium in the chart above is obtained from a statistical model developed by New York Federal Reserve Bank economists Tobias Adrian, Richard K. Crump, and Emanuel Moench (Tobias, Crump and Moench, "Pricing the Term Structure with Linear Regressions," Journal of Financial Economics, October 2013). Past performance is no guarantee of future results. For illustrative purposes only.
The term premium declined sharply between 2009 and 2019, as inflation fell and became more stable. It fell sharply during the financial crisis and the pandemic when the Fed stepped in to keep interest rates low. In recent months the term premium has been rising and is in positive territory. It is still well below its long-term average, however. If it were to return to the mid-point or higher end of its range, the 10-year Treasury yield could rise further.
How low can the Fed go?
If inflation pressures rise, the Fed's scope for lowering interest rates in 2025 will be limited. That is the assumption that is being discounted by markets. Inflation expectations, as captured in the Treasury Inflation Protected Securities (TIPS) market, have moved higher.

For illustrative purposes only.
Inflation expectations have moved higher, boosting the TIPS breakeven rate

Source: Bloomberg, daily data as of 11/26/2024.
Chart shows the U.S. Breakeven 10 Year (USGGBE10 Index) and U.S. Breakeven 5 Year (USGGBE05 Index). The difference between TIPS yields and yields offered by traditional Treasuries is known as the "breakeven inflation rate." The breakeven rate is the rate that inflation, as measured by the Consumer Price Index (CPI), would need to average over the life of the TIPS for it to outperform a traditional Treasury security. If the CPI averaged more than that breakeven rate, investors would have been better off in a TIPS; if it were below, a traditional Treasury would have made more sense.
At its September meeting, the Fed was projecting it would cut the federal funds rate to 2.75% to 3%. However, the futures market is discounting an ending or "terminal" rate closer to 4%.
Market expectations for the Fed's "terminal" rate have risen

Source: Bloomberg, daily data as of 11/26/2024.
World Interest Rate Probability (WIRP) Implied Overnight Rate for the US - Futures Model (US0AFR OCT2025 Index). WIRP Implied Overnight Rate for the U.S. - Futures Model represents the estimated forward rate for the United States using the futures model. This ticker utilizes "virtual ticker" technology to show multiple dimensions of data via a single ticker. By default (without a virtual component added) the ticker always references data for the upcoming meeting of the country under analysis. Once a meeting passes, the ticker then rolls to the next meeting. For illustrative purposes only.
Given the upside risks to inflation, it's likely that the Fed will take a more cautious approach to cutting rates by holding policy steady at some of the 2025 meetings. Unless the labor market weakens significantly, the path for the Fed rate cuts is likely to be slower and shallower than previously expected. A terminal rate between 3.50% to 4.0% seems reasonable to us for this cycle.
How high can bond yields go?
Short-term rates follow the path of the fed funds rate closely, but the longer-term maturities are also a function of expectations about growth and inflation.
Looking back over the last 30 years, the median yield spread between the federal funds rate and 10-year Treasuries has been 94 basis points, excluding periods when interest rates were at zero. (We exclude the zero-interest-rate-policy, or ZIRP, eras in the U.S. between December 2008-December 2015 and again from March 2020-March 2022 because those were extraordinary times when the Fed was fighting the threat of deflation due to crises.) The current spread is about negative 45 basis points, or 0.45%.
If the federal funds rate hits a low of 3.75% to 4.0% in this cycle, which is what the market is currently discounting, then it wouldn't be surprising to see 10-year yields near 5% at some point in 2025 (4% plus 94 basis points = 4.94%). However, if growth and inflation surprise on the downside, the Fed would likely lower rates to the 2.75% to 3.0% region that was indicated as the terminal rate in the last dot plot. Ten-year yields could fall back to near the recent low of 3.80%. We view this as a less likely outcome for 2025 than a higher range centered around 4.5%. It would probably require a sudden weakening in the labor market and steeper drop in inflation.
Choose your own adventure
For the past 30-plus years, the 10-year Treasury yield has traded within zero to 150 basis points above the federal funds rate 40% of the time. However, at times the spread has widened sharply; for instance, the 10-year yield has traded 350-400 basis points above the fed funds rate 4% of the time between 1990 and today, as shown in the chart below, and 150 basis points below the rate 2% of the time. With such a wide distribution of potential outcomes, the fixed income markets are likely to remain volatile until there is more clarity about the direction of policy. Early in the year, we would look for volatility to be high with 10-year Treasury yields trading in a wide range with an upward bias.
The 10-year Treasury yield sometimes diverges sharply from the federal funds rate
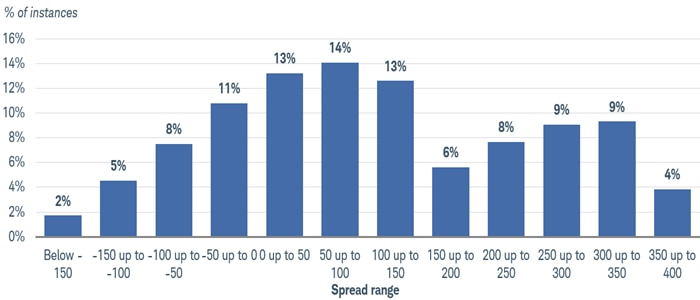
Source: Bloomberg, as of 11/8/2024.
Federal Funds Target Rate - Upper Bound (FDTR Index) and US Generic Govt 10 Yr (USGG10YR Index). using weekly data from 1/1/1990 through 11/8/2024, and only includes periods when the federal funds rate was 1% or higher. Past performance is no guarantee of future results.
To focus in more closely, we also look at a simple model based on the current fed funds rate, the term premium and inflation expectations derived from the TIPS market. If the only factor that changed was a decline in the fed funds rate to 4.25% to 4.5%, or two 25-basis-point cuts, then current 10-year Treasury yields are currently near fair value at about 4.5%. A drop in the fed funds rate to 3.75% to 4.0% would suggest 10-year Treasury yields could fall back to around 4.0%.
However, we look for the term premium to keep moving higher. With the potential for fewer Fed rate cuts and a higher deficit to fund, investors could reasonably demand more yield to compensate for those risks. A return to the average of the historical range could add as much as another 50 basis points to 10-year Treasury yields, all else being equal. That would mean an estimate for 10-year yields of near 5%. Hence, we are cautious about duration because the risks for long-term yields appear skewed to the upside.
Strategies to consider for an uncertain outlook
The bond market is caught between the Federal Reserve's plans to cut interest rates, and the risks to higher inflation and debt levels in 2025 from potential policy decisions made in Washington D.C. Given the uncertain outlook and timeline for policy, we favor adjusting duration to neutral or lower to help mitigate interest rate risk.
We use the Bloomberg US Aggregate Bond Index (AGG) for a benchmark of investment-grade bonds. Its duration is 6.2 years, but every investor should have their own benchmark. We view bond ladders as a helpful way to spread out maturities of bonds over time and managing duration.
We also favor higher-credit-quality bonds, such as investment-grade corporate and municipal bonds. Valuations are high, with the yield spreads compared to Treasuries at very low levels. However, the fundamentals look solid, and yields are at attractive levels.
Investment-grade bond yields are currently relatively attractive

Source: Bloomberg, as of 11/25/2024.
Indexes represented are: HY Corporates = Bloomberg U.S. Corporate High-Yield Bond Index; EM USD = Bloomberg Emerging Market USD Aggregate Index; Preferreds = ICE BofA Fixed Rate Preferred Securities Index; IG Corporates = Bloomberg U.S. Corporate Bond Index; MBS = Bloomberg U.S. MBS Index; U.S. Aggregate = Bloomberg U.S. Aggregate Bond Index; Treasuries = Bloomberg U.S. Treasury Index; Municipal Bonds = Bloomberg U.S. Municipal Bond Index; and Dividend Aristocrats = S&P 500 Dividend Aristocrats Index. Yields shown are the average yield-to-worst (the lowest possible yield that can be received on a bond with an early retirement provision) except for the Dividend Aristocrats, which is the average dividend yield. Indexes are unmanaged, do not incur management fees, costs and expenses and cannot be invested in directly. Past performance is no guarantee of future results.
Finally, periods of high volatility and rising yields can provide an opportunity for investors looking to capture more income over the long run. We will be watching for those opportunities. Over time, barring default, most of the return to fixed income investors comes in the form of interest income, or "coupon return." With starting yields in the 4.5% to 5.5% region on many core bonds, investors looking to capture income over time are likely to have a number of potential opportunities in 2025. Allocating to higher-credit-quality bonds and riding out the ups and downs of the market will likely be necessary but the overall prospects for returns look attractive.
Over time, most of the return to fixed income investors comes from coupon return

Source: Bloomberg. Total return date range 1/31/2000 to 10/31/2024.
Indexes represented are: EM USD = Bloomberg Emerging Market USD Aggregate Index; HY Corporates = Bloomberg U.S. Corporate High-Yield Bond Index; IG Corporates = Bloomberg U.S. Corporate Bond Index; TIPS = Bloomberg US Treasury Inflation Linked Bond Index; Munis = Bloomberg U.S. Municipal Bond Index; US Aggregate = Bloomberg US Aggregate Bond Index; Treasuries = Bloomberg U.S. Treasury Index; Int. developed (x-USD) = Bloomberg Global Aggregate ex-USD Index. Indexes are unmanaged, do not incur management fees, costs and expenses, and cannot be invested in directly. Past performance is no guarantee of future results.
1 Passel, J., and Krogstad, J.M., "What we know about unauthorized immigrants living in the U.S.," Pew Research Center, July 22, 2024.
2 Mukherjee, S., and Krogstad, J.M., "Most U.S. voters say immigrants – no matter their legal status – mostly take jobs citizens don't want," Pew Research Center, October 21, 2024.