Weekly Trader's Outlook
Volatility Hits Wall Street, Triggered by Strong Jobs Report & Corresponding Yield Spike

The Week That Was
If you read last week's blog, you might recall that I had a "Moderately Bullish" forecast for this week, citing persistent bullish momentum and healthy technicals. This week stocks continued marching higher for the first part of the week (the SPX hit a fresh all-time high on Tuesday), but then hit some volatility/selling pressure during the back of this week on several catalysts: a) Google-parent Alphabet launched a historic $85B equity raise to help fund its aggressive artificial intelligence (AI) infrastructure buildout; b) AI chip giant Broadcom issued lackluster guidance on Wednesday and the stock sank 20% post-results; and c) Treasury yields spiked today following a blowout monthly jobs report (see "Economic Data, Rates & the Fed" section below). Also noteworthy, a Financial Times report came out around 2:30 p.m. ET today saying that Meta Platforms may launch a multi-billion-dollar equity offering to assist with their own AI ambitions. Elsewhere, bitcoin is down roughly 20% this week and perhaps more importantly, is currently trading below the February low (~$60,000) and the 200-week simple moving average (~$62,000). The Cboe Volatility Index (VIX), which hit a four-month low of 15.18 yesterday, is spiking 28% today as equity markets are seeing the largest one-day drop since last October. The spike in bond yields, and corresponding shift in expectations around potential rate hikes form the Federal Reserve is certainly a factor in today's market sell-off, but there are other factors in play: a) the S&P 500 rallied 20.6% from March 30th to Tuesday of this week without a healthy pullback to digest gains; b) the highly anticipated, and highest valued IPO in history, SpaceX, begins trading next Friday and investors may be raising funds by selling recent winners; c) the driver behind the recent rally has been AI-infrastructure optimism, which has continually been fueled by Q2 "beat and raise" earnings reports from AI-related companies, but now we are in-between earnings seasons; and d) the month of June is not bullish from a seasonality perspective. Having said that, getting 5-10% pullbacks in bull markets on the way up is normal from a historical perspective, so perhaps we've encountered one of these consolidation periods.
Outlook for Next Week
At the time of this writing (3:12 p.m. ET) all the majors are lower across the board and near the lows of the session (DJI - 687, SPX - 198, $COMP – 1,112, RUT - 111). The brunt of the selling is being seen in tech stocks, and particularly chip stocks as the Philadelphia Semiconductor Index (SOX) is down 9.5% at the time of this writing. As traders, we shouldn't be too shocked by this sharp pullback in tech stocks, given the velocity of the rally over the past two months. The difficulty is attempting to use indicators which will help traders prepare for this type of countertrend move (for example, I've discussed in this blog that a stretched RSI will not provide such signal). Of course, the question with trading, and in life, is where do we go from here? Top of my mind are: a) will there be any forced liquidation on leveraged positions early next week, or did we flush out excess today? b) assuming some of this selling pressure is being driven by fund raising for the SpaceX IPO, will that continue next week up until Friday when it begins trading, or is that behind us now? c) will Treasury yields continue to push higher next week (two-year yields are at 4.164% at the time of this writing, a fresh 52-week high)? d) the PHLX Semiconductor Index is right at its 20-day SMA today, will buyers step back in like they did back in mid-May? e) will Apple deliver or disappoint on its AI offering at Monday's World Wide Developers conference? f) will next week's monthly consumer price index (CPI) and producer price index (PPI) reports come in hot and be a catalyst for higher yields (PPI has been hot last two months)? Perhaps I need a mental vacation, but as you can see there are a lot of unanswered questions and several potential market-moving catalysts next week. Therefore, I'll provide a "Higher Volatility" forecast for next week. From a bullish perspective, the fundamentals are intact (the economy is strong and the AI infrastructure build-out is still in the expansionary phase), and the dip buyers have shown up on pullbacks. From a bearish perspective, I'm a little concerned that today's sharp drop across the tech sector may have damaged both momentum and dip-buyer mentality.
Other Potential Market-Moving Catalysts
Monday (June 8): Apple World Wide Developer's Conference (WWDC)
Economic:
- Monday (6/8): no reports
- Tuesday (6/9): Existing Home Sales, Trade Balance, Wholesale Inventories
- Wednesday (6/10): Consumer Price Index (CPI), EIA Crude Oil Inventories, MBA Mortgage Applications Index, Treasury Budget
- Thursday (6/11): Continuing Claims, EIA Natural Gas Inventories, Initial Claims, Producer Price Index (PPI)
- Friday (6/12): University of Michigan Consumer Sentiment
Earnings:
- Monday (6/8): Campbell's Co. (CPB), FuelCell Energy Inc. (FCEL), Graham Corp. (GHM), Motorcar Parts of America Inc. (MPAA), Mission Produce Inc. (AVO), Vail Resorts Inc. (MTN)
- Tuesday (6/9): Academy Sports and Outdoors Inc. (ASO), Casey's General Stores Inc. (CASY), Cracker Barrel Old Country Store Inc. (CBRL), J.M. Smucker Co. (SJM), Sailpoint Inc. (SAIL), Uranium Energy Corp. (UEC), VinFast Auto Ltd. (VFS)
- Wednesday (6/10): Anterix Inc. (ATEX), Chewy Inc. (CHWY), Core & Main Inc. (CNM), Navan Inc. (NAVN), Oracle Corp. (ORCL), Oxford Industries Inc. (OXM)
- Thursday (6/11): Adobe Inc. (ADBE), Aurora Cannabis Inc. (ACB), Lennar Corp. (LEN), Lovesac Co. (LOVE), McGraw Hill Inc. (MH), RH Inc. (RH)
- Friday (6/12): no reports
Economic Data, Rates & the Fed
There was a heavy dose of economic data for markets to digest this week which was highlighted by this morning's blowout monthly Nonfarm Payrolls report. Not only did May payroll gains double economists' estimates, but April was revised significantly higher. Also signaling labor market strength, April job openings jumped to a two-year high. Elsewhere, the monthly ISM Manufacturing and Services reports both signaled strong expansion, which continues to signal a healthy U.S. economy. However, the strong economic data is sending Treasury yields higher as potential rate hike expectations from the Federal Reserve appear to be gaining traction. Here's a breakdown of the reports:
- Nonfarm Payrolls: Headline payrolls rose by 172,000 in May, which was well above the +80,000 economists were expecting. Additionally, April payrolls were revised up to 179,000 from the initial report of 115,000.
- Unemployment Rate: Remained at 4.3% from the prior month and in-line with estimates.
- Average Hourly Earnings: Average hourly earnings increased 0.3% month-over-month and +3.4% on a year-over-year basis (both in-line with estimates).
- Labor Force Participation: Remained at 61.8% in May from the prior month.
- Average Workweek: 34.3 versus 34.3 expected.
- ADP Employment Change: U.S. private employers added 122K jobs in May, which represents the strongest month for private payrolls since January of 2025 and above the +110K expected.
- JOLTs-Job Openings: Unexpectedly jumped 738,000 in April to 7.618M from the prior month, well above the 6.88M economists were expecting. This represents the highest figure since May of 2024.
- ISM Non-Manufacturing Index: Increased to 54.5% in May from 53.6% in April, remaining firmly in expansionary territory (> 50.0). The Prices Index increased to 71.3 in May from 70.7 in April, which represents the highest level since August of 2022.
- ISM Manufacturing Index: Increased to 54.0% in May from 52.7% in April, remaining in expansionary territory for the fifth consecutive month. This represents the highest PMI reading since May of 2022. The Prices Index decreased to 82.1 in May from 84.6 in April but remains in expansion or "increasing" territory.
- S&P Global U.S. Manufacturing PMI: Climbed to 55.1 in May from 54.5 in April, which was slightly below the 55.3 economists were expecting.
- Factory Orders: 4.8% vs. 4.0% est.
- Construction Spending: 0.4% vs. +0.5% est.
- New Home Sales: Rose 7.4% in March from the prior month to a seasonally adjusted annual rate of 682K, which was above the 650K economists were expecting.
- Productivity-Revised: 0.3% vs. 0.8% est.
- Unit Labor Costs-Revised: 1.8% vs. 2.5% est.
- Construction Spending: 0.4% vs. 0.5% est.
- EIA Crude Oil Inventories: -7.97M barrels.
- EIA Natural Gas Inventories: +95 bcf.
- Initial Jobless Claims: Initial applications for US jobless benefits increased 13K from last week's (downwardly revised) 212K to 225K, which was above the 210K economists had expected. Continuing Claims decreased 8K from the prior week to a seasonally adjusted 1.777M.
- The Atlanta Fed's GDPNow "nowcast" for Q2 GDP was revised down to 3.0% on Monday from 3.8% last week due to downward revisions to consumer spending and investment.
U.S. Treasury yields jumped across the curve this week, with the bulk of the move coming today, due to this morning's blowout Nonfarm Payrolls report. The Treasury yield curve is seeing some flattening today as 2-year yields push to a 52-week high today. Compared to last Friday, 2-year Treasury yields jumped ~15 basis points (4.153% vs. 4.00%), 10-year yields are up ~10 basis points (4.53% vs. 4.439%), while 30-year yields increased ~3 basis points (5.013% vs. 4.981%).
Market expectations around the Federal Reserve's monetary policy shifted towards a rate hike as the next move by the Fed, driven by this morning's strong jobs report. Per the Bloomberg rate probabilities, market expectations at the October FOMC meeting jumped from 31.5% to 66.2% week-over-week. Additionally, the first theoretical 100% probability of a rate hike was pulled forward to the December FOMC meeting versus last week's 91% chance at the April FOMC meeting.
Technical Take
S&P Equal Weight Index (SPX - 132 to 7,451)
The S&P 500 index (SPX) is experiencing its largest one-day drop (currently -1.70%) since March today, which appears to be driven by a spike in Treasury yields, though there are other factors that could be contributing to the selling pressure. The SPX's nine-week winning streak of gain looks like it will come to an end today. Today's drop is putting the index below its 20-day Simple Moving Average (SMA) for the first time since early April, which can sometimes be an indicator that is looked to for support in an uptrend. The question is whether dip buyers are going to step in next week like they've done several times during this recent two-month ~20% rally. I'd also point out that there is a negative divergence in the Relative Strength Indicator (white lines in the chart below), so the near-term technical assessment for the SPX is in the bearish camp this week.
Near-term technical translation: moderately bearish
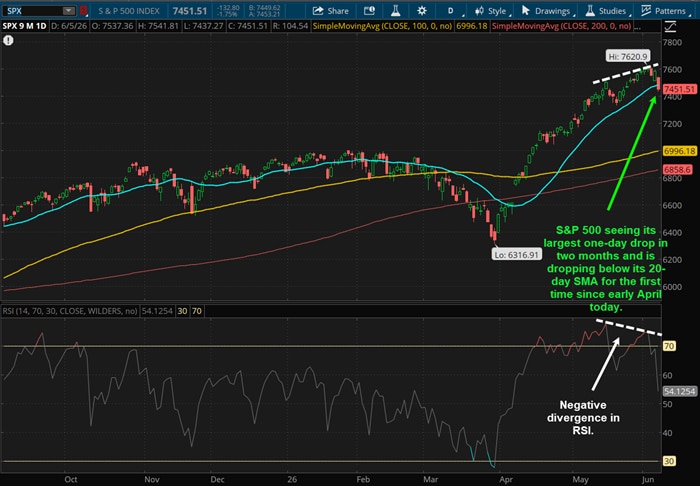
Source: ThinkorSwim trading platform
Past performance is no guarantee of future results.
PHLX Semiconductor Index (SOX - 1,081 to 12,535)
The PHLX Semiconductor Index (SOX) hit a fresh all-time high of 13,998 on Wednesday but is now down just over 10% since then. A 10% pullback is defined as a standard "correction" in finance, but the velocity of the rally in the SOX since April has been anything but normal. Keep in mind that the SOX is still up 65% since the start of April, even with the 10% pullback over the last 48 hours. However, the pullback is bringing the SOX back its 20-day SMA, which is where the index found support back in mid-May, so it's possible that history repeats next week. Yes, we are still in a bullish uptrend from a long and intermediate-term perspective, but it feels like the index price is at a critical juncture. Meaning, if it bounces off the 20-day SMA next week this will likely reinvigorate dip buyers, but if support fails here, this could exacerbate selling pressure. Technically bullish in my view since the index is in a bullish uptrend with a healthy pullback to the 20-day SMA, but tread lightly as selling pressure could intensify (given the velocity of this two-month rally) if support doesn't hold up next week.
Near-term technical translation: cautiously bullish
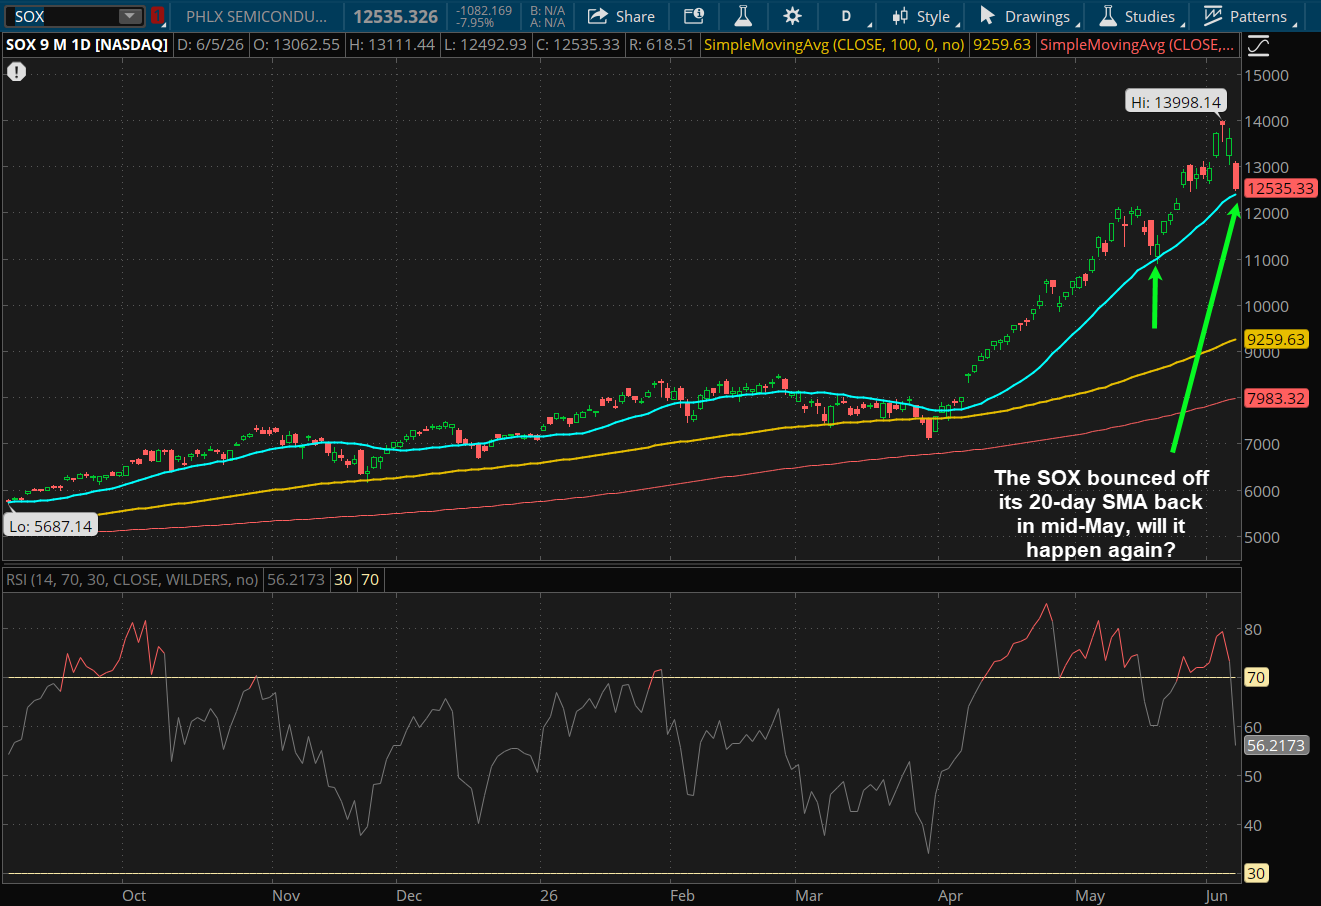
Source: ThinkorSwim trading platform
Past performance is no guarantee of future results.
Cryptocurrency News
The Bitwise 10 Large Crypto Index is down 16% week over week, with bitcoin down 17% and ether down 19% at the time of writing this on Friday. Bear markets exist to flush out excess leverage, which has been apparent over the past week. Some investors have attributed the price action to sales stemming from Strategy (MSTR), but that ignores one of the fundamental reasons crypto investors have historically bought or sold crypto—momentum.
Crypto investors have historically been momentum-driven, and following the start of the bear market, investors quickly shifted gears to chasing precious metals in the fall, oil futures at the onset of the conflict in Iran, and most recently into memory stocks and private vehicles tied to future IPOs.
While bitcoin's recent price action may have appeared sharper than warranted given what may have been a capital rotation, this overlooks the fact that leverage had quietly rebuilt in crypto markets, albeit at lower levels than in prior years. In February, futures open interest had fallen to $31 billion from a peak of $70 billion. Over the past few months, it had risen to a peak of $51 billion in May. While futures positioning wasn't extremely stretched in terms of total open interest, given the shallow recovery from the bear market, it may have been a sign that investors went too far too fast.
Since Friday, nearly $10 billion in long futures contracts have been liquidated. While open interest is still above February's levels, it has declined alongside the recent move, indicating that positions are being closed rather than rebuilt, consistent with a near-term reduction in leveraged exposure. Liquidations as a percent of total open interest also indicate a moderate degree of forced positioning unwind.
The recent move appears consistent with a derivatives-driven unwind rather than a renewed build in leverage. Open interest has declined, liquidation activity has spiked, and funding rates have moved back toward negative territory, indicating a reduction in prior long crowding. While liquidation spikes often occur during periods of market stress and can coincide with local bottoms, they are not sufficient on their own to confirm one and must be assessed alongside sustained changes in open interest and funding to determine whether deleveraging has fully played out. Taken together, current conditions point to a near-term reduction in leveraged exposure. With prices back near February's lows, efficient miner production costs, and the 200-week moving average, positioning and technical levels suggest the recent selloff may be approaching exhaustion.
While not extreme, there had been a modest rebuild in leverage since the market bottomed in February
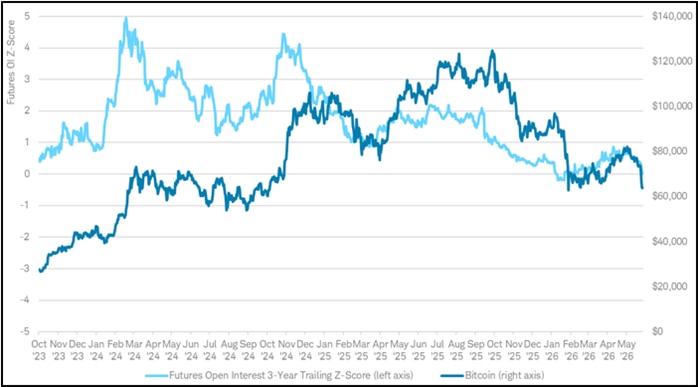
Source: Glassnode, Bloomberg LP
Long futures liquidations as a percent of open interest highlight periods of forced positioning stress, which can coincide with local bottoms when confirmed by open interest and funding dynamics
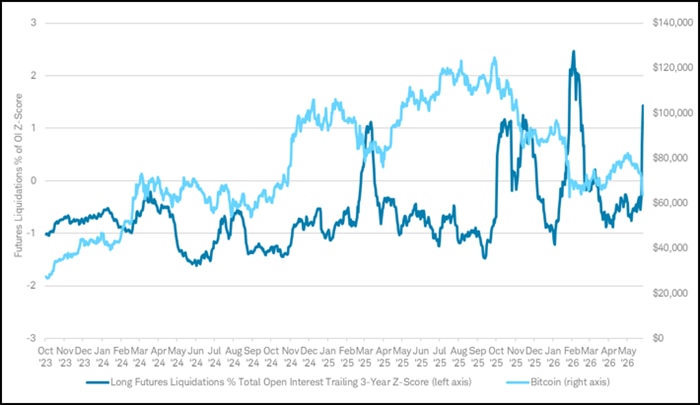
Source: Glassnode, Bloomberg LP
Bitcoin perpetual futures funding rates have turned negative, indicating a shift in positioning following the recent deleveraging
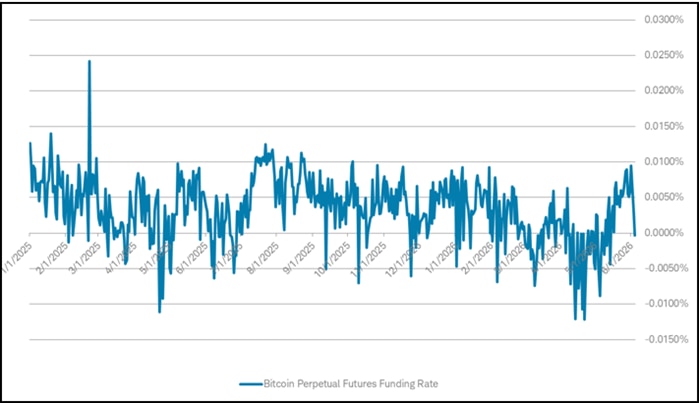
Source: Glassnode
Market Breadth
The Bloomberg chart below shows the current percentage of members within the S&P 500 (SPX), Nasdaq Composite (CCMP), and Russell 2000 (RTY) that are trading above their respective 200-day Simple Moving Averages (SMA). In short, stocks are down on the week, and market breadth contracted as a result. Compared to last Friday, the SPX (white line) breadth moved down to 59.00% from 60.08%, the CCMP (blue line) dropped to 45.49% vs. 47.04%, and the RUT (red line) eased to 60.30% from 62.76% (all week-over-week).
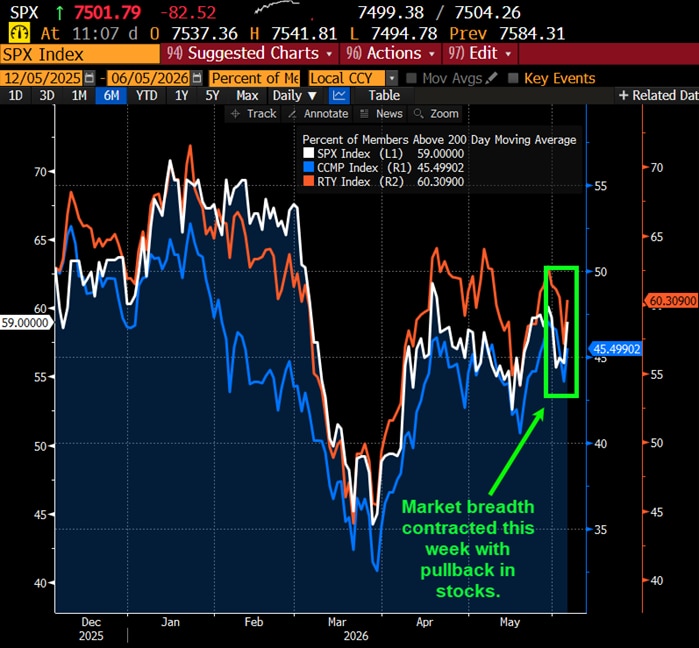
Source: Bloomberg L.P.
Market breadth attempts to capture individual stock participation within an overall index, which can help convey underlying strength or weakness of a move or trend. Typically, broader participation suggests healthy investor sentiment and supportive technicals. There are many data points to help convey market breadth, such as advancing vs. declining issues, percentage of stocks within an index that are above or below a longer-term moving average, or new highs vs. new lows.
This Week's Notable 52-week Highs (71 today): Apple Inc. (AAPL + $1.31 to $312.54), Caterpillar Inc. (CAT - $13.79 to $926.69), Cisco Systems Inc. (CSCO - $4.41 to $125.59), Nucor Corp. (NUE - $2.77 to $259.51), SanDisk Corp. (SNDK - $91.68 to $1,669.00), United Rentals Inc. (URI - $5.40 to $1,079.21)
This Week's Notable 52-week Lows (70 today): Alnylam Pharmaceuticals Inc. (ALNY - $0.38 to $303.26), Boston Scientific Corp. (BSX + $0.66 to $49.51), Chipotle Mexican Grill Inc. (CMG + $1.39 to $29.57), Inspire Medical Systems Inc. (INSP + $0.15 to $42.34), MasterCard Inc. (MA + $2.84 to $284.70), Shake Shack Inc. (SHAK - $0.53 to $52.82)