3 Bearish Trading Patterns

In technical analysis, charts revealing bearish patterns can suggest to traders that a company's share price may tumble over the ensuing days or months. While this may or may not unfold, even a well thought-out trade could turn sour due to unexpected news such as an earnings miss, worsening market sentiment, or world events. Here are three ways bearish technical traders look for early signs of decline.
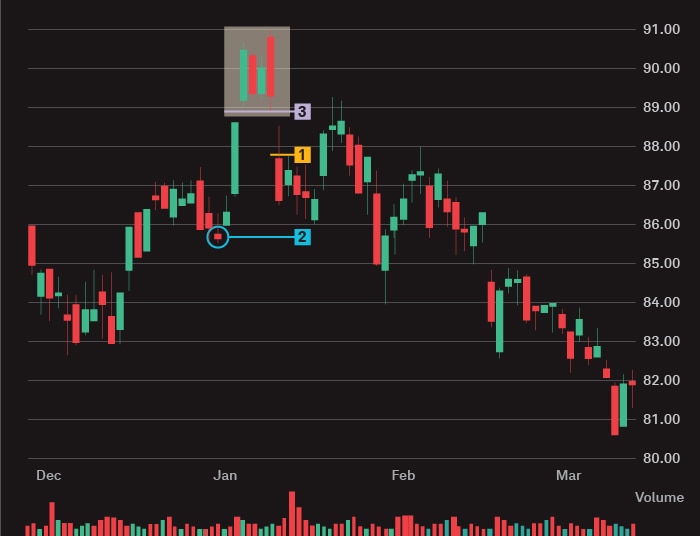
1. Island top
This reversal pattern can mark the end of an uptrend. It is one of the shortest bear patterns, generally taking just three to five days to form.
The first indication of an island top is a significant gap up, or sharply higher price at the open, following an upward price trend. If, after a few days of trading in a narrow range, the stock experiences a commensurate gap back down—creating a distinct peak, or island top—it may mean the uptrend has reversed.
Given the short time frame, island tops can be difficult to detect. Strong trading volume when the stock gaps down can act as a confirming signal.
Trading an island top
Traders may consider waiting until there is a corresponding gap down before opening a short position (1) and setting a profit target near the last pullback before the island top emerged (2). As a safeguard, short selling traders could open a buy stop order around the price where the stock initially gapped up (3).
Source: Schwab.com.
For illustrative purposes only.
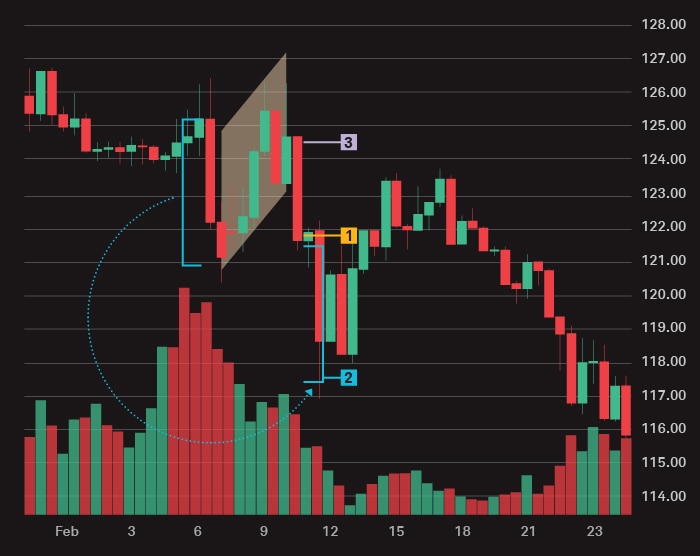
2. Bear flag
This short-term bearish pattern occurs when a longer-term downtrend briefly rebounds. It can help traders determine whether the stock's descent is over or will continue, and it typically takes from five days to three weeks to form.
A bear flag begins with the "flagpole," which develops from a swift decrease in price. When the stock finds a near-term low and it trades within a tight range for a period of days, the high and low trend lines will form the flag—the shape of which can be horizontal or upward sloping. Proponents of the bear flag pattern say that if the price breaks below the flag's lower trend line, the stock is likely to resume its prior downtrend.
Trading a bear flag
Traders may consider waiting to enter a position until the price breaks below the lower trend line (1). As for when to pull the plug on a bear-flag trade, a common approach is for traders to subtract the length of the flagpole from the breakdown price and set a profit limit order there (2). Traders could also opt to close out only half of their position when it hits the first stop and place a trailing stop that will allow them to further profit if the price moves lower. Finally, to help manage risk, traders may consider placing a stop order above the flag's lower trend line (3).
Source: Schwab.com.
For illustrative purposes only.
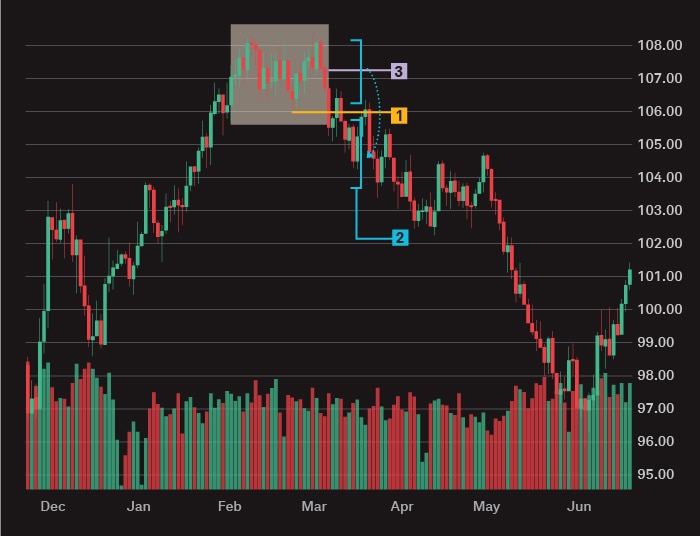
3. Double top
This reversal pattern may indicate the end of a long-term uptrend and the beginning of a downtrend, usually denoting a major shift in sentiment. It typically takes at least a month and sometimes as much as a year to form.
A double top pattern forms when a strong uptrend is followed by two distinct peaks at roughly the same price level with a trough in between. Fans of this pattern say if the price breaks below the trough, a downtrend may be forthcoming.
Trading a double top
Traders may consider waiting for the price to drop below the trough before opening a short position (1), as the stock might reach a support level. If it breaks to the downside—which suggests further weakness—supporters of the double top claim that odds are strong the former uptrend is over. To find a profit target, a trader can subtract the height of the tops from the breakdown price (2). As with a bear flag, closing out part of the position at the initial target and setting a trailing stop can potentially help a trader should the stock continue to fall. To protect against a trend reversal, a trader may place a stop order slightly above the trough (3).
Source: Schwab.com.
For illustrative purposes only.
A word of caution
Downward price movements can happen much faster than upside moves—and they also reverse more quickly—so traders need to be nimble when trading bear patterns.
For this reason, traders may consider starting with smaller positions and setting firm price targets for closing those out. Using trailing stop orders can also help manage sudden reversals, which can eat into profit or create losses.