3 Financial Statements to Measure a Company's Strength

When the stock market boomed in the 1920s, investors essentially had to fly blind in deciding which companies were sound investments because, at the time, most businesses had no legal obligation to reveal their finances. After the 1929 market crash, the government enacted legislation to help prevent a repeat disaster. To this day these reforms require publicly traded companies to regularly disclose certain details about their operations and financial position.
The income statement, balance sheet, and statement of cash flows are all required financial statements. These three statements are informative tools that traders can use to analyze a company's financial strength and provide a quick picture of a company's financial health and underlying value.
This article will provide a quick overview of the information that you can glean from these important financial statements without requiring you to be an accounting expert. Important note: The particular line items and terminology shown in these hypothetical financial statements are provided as illustrative examples only. Companies have a variety of ways to organize and display their financial statements. Each example is from a different hypothetical company.
Statement #1: The income statement
The income statement makes public the results of a company's business operations for a particular quarter or year. Through the income statement, you can witness the inflow of new assets into a business and measure the outflows incurred to produce revenue.
Profitability is measured by revenue (what a company is paid for the goods or services it provides) minus expenses (all the costs incurred to run the company) and taxes paid.
The income statement is read from top to bottom, starting with revenue, sometimes called the "top line." Expenses and costs are subtracted, followed by taxes. The end result is the company's net income—or profit—before paying any dividends. This is where the term "bottom line" comes from.
Income statement example for YYZ Corp.* for the year ending Dec. 31, 2024 (in millions)

* YYZ Corp. is a hypothetical example used for illustrative purposes only.
There are three main sections at the top of the statement. "Net sales (revenue)" shows how much money the company generated from selling products and services. "Cost of sales" captures the cost of that activity, again broken out by products and services. Next, the chart summarizes the company's "Operating expenses," broken out by "Research and development" and "Selling, general and administrative costs," which covers day-to-day operations and things like salaries and bonuses. When you subtract costs and expenses from revenue, you get "Operating income," and when you subtract taxes from that, you get "Net income."
You can see that net income for YYZ Corp. declined $67 million to $43 million, year over year.
The next line in the income statement displays the average number of common shares of the company's stock that are held by investors, which has held steady at 25 million. Next comes the firm's earnings per share, which is calculated by dividing net income by the number of shares.
Finally, the last line shows the dividends declared per common share, which is the cash payment per share (if any) the company makes to stockholders. The amount of any dividend payment is at the discretion of the company's board of directors.
Statement #2: The balance sheet
While the income statement is a record of the funds flowing in and out of a company over a given time period (for example, over a full year), the consolidated balance sheet is a snapshot of a company's financial position at a point in time. In other words, the balance sheet shows what a company owns (its assets) and owes (its liabilities) and the difference between the two (stockholders' equity). This difference represents the book value of the stockholders' stake in the company. It's called a balance sheet because both sides of the equation must balance: assets = liabilities + stockholders' equity.
The balance sheet displays:
- Assets listed in order from most liquid to least liquid (in other words, assets that can be most quickly converted to cash are listed first)
- The portion of those assets financed with debt (liability)
- The portion of equity (retained earnings and stock shares)
- Liabilities listed in order of immediacy (those that have the most senior, or highest priority, claim on a firm's assets are listed first)
Balance sheet example for XXY Corp. for the year ending Dec. 31, 2024 (in millions)

* XXY Corp. is a hypothetical example used for illustrative purposes only.
The amount by which assets exceed liabilities is listed as total shareholders' equity, and this represents the net worth of a company. In this example, shareholders' equity includes:
- Stock, or the amount of money that investors have put into the company
- Additional paid-in capital, or the amount of money that investors paid for the company's stock in excess of the stock's par, or face, value
- Retained earnings, or the accumulated profits a company has gathered over time to reinvest in its operations
Statement #3: The statement of cash flows
As with an income statement, the statement of cash flows reflects a company's financial activity over a period of time. It shows where a company's cash comes from and how it's used to pay for operations and/or to invest in the future. By showing how a company has managed the inflow and outflow of cash, the statement of cash flows may paint a more complete picture of a company's liquidity (the ability to pay bills and creditors and fund future growth) than the income statement or the balance sheet.
Statement of cash flows example for ZZQ Corp. for the year ending Dec. 31, 2024 (in millions)
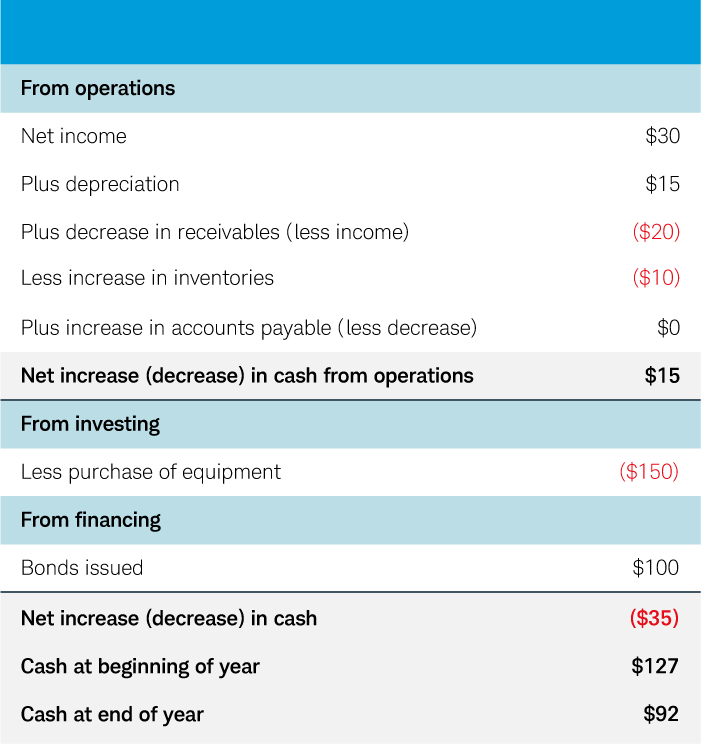
* ZZQ Corp. is a hypothetical example used for illustrative purposes only.
Cash flow from operations
Income and expenses on the income statement are recorded when a company earns revenue or incurs expenses, not necessarily when cash is received or paid. Similarly, the depreciation of owned assets is added back to net income, as this expense is not a cash outflow.
That's why analysts often look to cash flow from operations as the most important measure of performance, as it's the most transparent way to gauge the health of the underlying business. A decrease in cash flow due to a sharp increase in inventory or receivables can signal that a company is having trouble selling products or collecting money from customers.
Cash flow from investing and financing
Cash flow from investing includes cash received from or used for investing activities, such as buying stock in other companies or purchasing additional property or equipment. Cash flow from financing activities includes cash received from borrowing money or issuing stock, and cash spent to repay loans.
Measuring a company's financial strength
The stock price for a given company can advance or decline based on a wide variety of factors. However, companies that perform well financially by increasing their earnings, net worth, and cash flow are typically rewarded with a higher stock price over time. When it comes to trading, knowledge is power. Even traders who generally rely on technical factors to make their trading decisions may benefit from learning to use standard financial statements to find companies that are experiencing strong or improving fundamentals.