4 Volatility Metrics to Inform Your Trades

Stoic philosophers in ancient Greece and Rome believed that whether an event beyond our control is good or bad depends only on our reaction to it. When it comes to volatility, they may have a point.
Volatility is simply a measure of how much and how quickly stocks move up or down. It can certainly feel nerve-wracking, but it can also create potential opportunity for traders who know how to interpret it.
Here are four common methods of measuring volatility—all available on Schwab's proprietary thinkorswim® trading platform—and how traders can use them to inform their trade decisions.
1. Cboe Volatility Index®
The Cboe Volatility Index (VIX®), a.k.a. the "fear index," measures the market's expected volatility over the next 30 days based on S&P 500® Index options contracts. A VIX reading above 20 usually indicates elevated market volatility, and north of 30 often coincides with big retreats. That said, the VIX rarely remains above these levels for more than a few days.
How to use it: Active traders might consider building new positions or adding to existing ones when the VIX is running high, as sharp spikes often coincide with broad market pullbacks. Extreme surges in the VIX may also create opportunities to buy low if a strong pullback does indeed materialize.
When up means down
A VIX level of 30 or above often coincides with big retreats in the S&P 500.
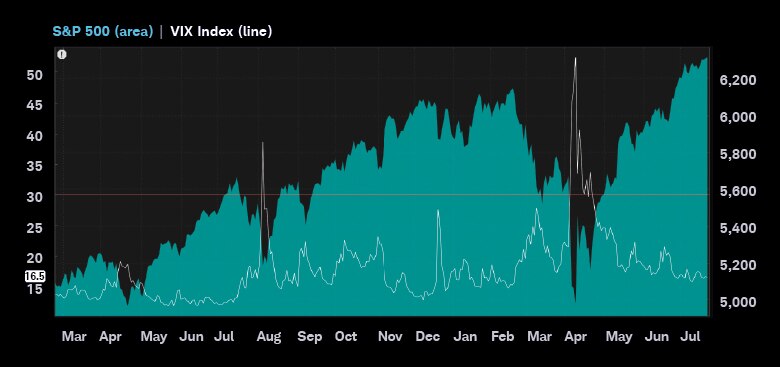
Source: thinkorswim® desktop for Mac.
For illustrative purposes only. Individual situations will vary. Not intended to be reflective of results you can expect to achieve.
To view the VIX
Log in to thinkorswim desktop, click Charts, then type "VIX" in the search box. To add the S&P 500 for comparison, click Edit studies (beaker icon) and type "Comparison" in the search box. Double-click Comparison to add it to the chart, then click the gear icon to customize the comparison. In the secondary security box, type "SPX," click OK to close the window, then click OK to view the chart.
2. Implied volatility
Implied volatility (IV) gauges the market's expectation of how much a stock's price will fluctuate based on its options contracts. IV tends to increase ahead of expected news—most notably company earnings but also drug approvals, merger announcements, and product launches. As with the VIX, these episodes can be fleeting, with the price either recovering or falling back to earth in short order.
How to use it: Trading on pending news is inherently unpredictable—markets often price in events ahead of time or react contrary to expectations. That's why rising IV levels are often used as a cue to look for corroborating signals of strength or weakness. For example, an uptick in IV that coincides with the stock breaking above its simple moving average (SMA), such as its 20-day line, can signal a shift in momentum (see "Go time?"). Conversely, if a stock's IV is climbing but its price is stuck below resistance, it might be a sign of true weakness.
To view the IV for a specific stock
Log in to thinkorswim desktop, click Charts, then type the stock symbol in the search box. Once the chart populates, click Edit studies (beaker icon) and type "ImpVolatility" in the search box. Double-click ImpVolatility to add it to the chart, then click OK.
3. Average true range
Average true range (ATR) is a backward-looking measure of a stock's average range of price fluctuations over a specified period. It's not a directional indicator; rather, it reflects the degree of volatility regardless of whether the price is trending up or down.
How to use it: Traders often set predetermined exits for a position and may use ATR to establish limit (as price rises) and stop (as price falls) points on an open position. It can be especially helpful in determining strategic exit points if a spike in IV signals a potentially favorable entry. Traders typically set a stop as a multiple of the ATR, generally 1x to 2x above the breakout price. The higher the multiple, the more risk and therefore greater potential reward. If the stock continues to trade up, they will either keep replacing the stop at regular intervals, based on its ATR at the time, or use a trailing stop that adjusts automatically.
Go time?
🅐 An IV spike ahead of 🅑 an earnings announcement coincided with 🅒 a break above the stock's 20-day simple moving average, potentially indicating positive momentum. 🅓 Opening a position at $190 and using 🅔 the stock's ATR to 🅕 set a $10 trailing stop order would have allowed a trader to capture the subsequent upswing.
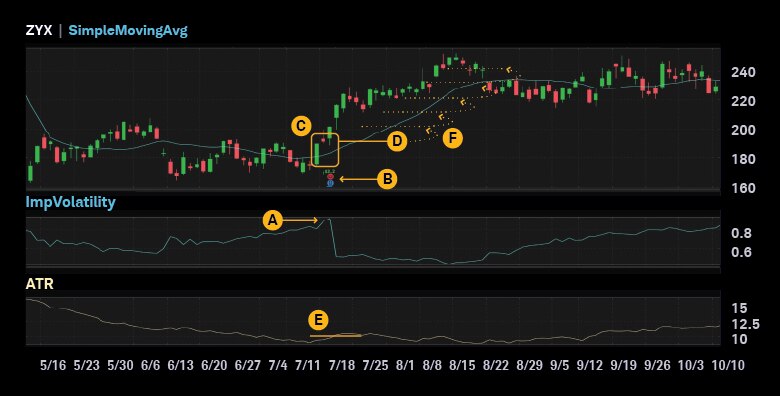
Source: thinkorswim® desktop for Mac.
For illustrative purposes only. Individual situations will vary. Not intended to be reflective of results you can expect to achieve.
To view the ATR for a specific stock
Log in to thinkorswim desktop, click Charts, then type the stock symbol in the search box. Once the chart populates, click Edit studies (beaker icon) and type "ATR" in the search box. Double-click ATR to add it to the chart, then click OK.
4. Bollinger bands
Bollinger bands consist of three bands: The upper and lower bands represent standard price deviations, while the middle band depicts a stock's moving average. Many traders use them to identify whether a stock's price is relatively high or low, but they can also be used to evaluate a stock's volatility by examining the distance between the bands—the narrower the distance, the lower the volatility, and vice versa.
How to use it: When the width between a stock's upper and lower bands narrows more than usual, a surge in volatility may be on the horizon. That's because volatility tends to revert to the mean: Periods of low momentum are typically followed by sharp price swings. Combined with a break above a line of resistance (such as a 20-day SMA), a narrowing width between bands is a bullish signal; with a break below a line of support, it's a bearish one.
Bear facts
A stock enjoyed a long uptrend before 🅐 its Bollinger bands narrowed in late July—in tandem with the price's break below its 20-day moving average. 🅑 Traders who noticed this could have either exited a long position or opened a short position before its subsequent drop. While this example turned out well, traders who short a stock should have an exit plan in case the trade moves against them.
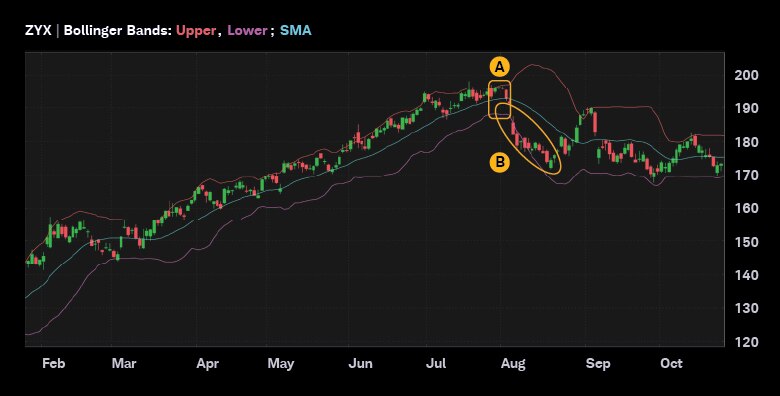
Source: thinkorswim® desktop for Mac.
For illustrative purposes only. Individual situations will vary. Not intended to be reflective of results you can expect to achieve.
To view the Bollinger bands for a specific stock
Log in to thinkorswim desktop, click Charts, then type the stock symbol in the search box. Once the chart populates, click Edit studies (beaker icon) and type "Bollinger" in the search box. Double-click BollingerBands to add them to the chart, then click OK.
Keep your cool
Traders who treat volatility as neutral information, rather than something inherently positive or negative, may be better positioned to weather periods of uncertainty. Those with a level head and risk appetite may find this disciplined approach worth considering during periods of volatility.
Discover more from Onward

Keep reading the latest issue online or view the print edition.