Aligning Options Strategies and Implied Volatility

It's always useful to know what the market is thinking, and implied volatility (IV) offers a window into the market's collective mind. Option prices—quantified by IV—can offer a look into market expectations about how far the price of a stock or other underlying asset might move in the future.
Traders use that insight in multiple ways: to inform views of options prices, to estimate potential trading ranges and optimal entry and exit points, and even to gauge market sentiment. Implied volatility is used in the Cboe® Volatility Index (VIX), for example, the most widely used measure of short-term volatility in the S&P 500® index (SPX), which many traders track to gauge market sentiment.
Below we'll explain what implied volatility is, how it's calculated, and how option traders use it to help inform their trading decisions.
What is implied volatility?
IV is a collective, indirect estimate of the underlying market's future volatility. It's calculated using an options-pricing model, most commonly the Black-Scholes-Merton (BSM) model, and expressed as an annualized percentage—the expected volatility for an entire year. Note that IV does not predict price direction, only magnitude. The anticipated move could be up or down. And while IV uses statistics, it's derived from the views of market participants who could be wrong.
Let's look at an example. If the IV of underlying stock ZYX is 25%, that means the market sees a roughly 68% chance that at the end of 12 months the price will be within 25% of the current price, whether higher or lower. So, if ZYX is currently $100 per share, an IV of 25% indicates a 68% chance that the price will end the year within a range of $75 and $125. By comparison, if stock FAHN has an IV of 50% and a current price of $100, the market expects it to be about twice as volatile as ZYX, ending the upcoming 12-month period in a range of $50 and $150.
All else being equal, the higher the IV of an option, the bigger possible price change traders expect in the underlying asset and therefore the higher the options premium, or price. In other words, buyers pay more for options on securities that are expected to see bigger price moves because the potential for profit is higher.
For a graphical representation of the probabilities of an underlying market's potential moves, traders can use a probability cone on the thinkorswim® platform (see image below).
To view a probability cone on thinkorswim, select Probability Analysis on the Analyze tab. A probability cone uses IV to depict a range of potential price outcomes at different levels of volatility. In the example below, with IV at 33.13%, there is a 68.27% chance the price will land within the cone at each future date. Why 68.27%? That's the percentage of outcomes that fall within one standard deviation of the mean under a log-normal distribution.
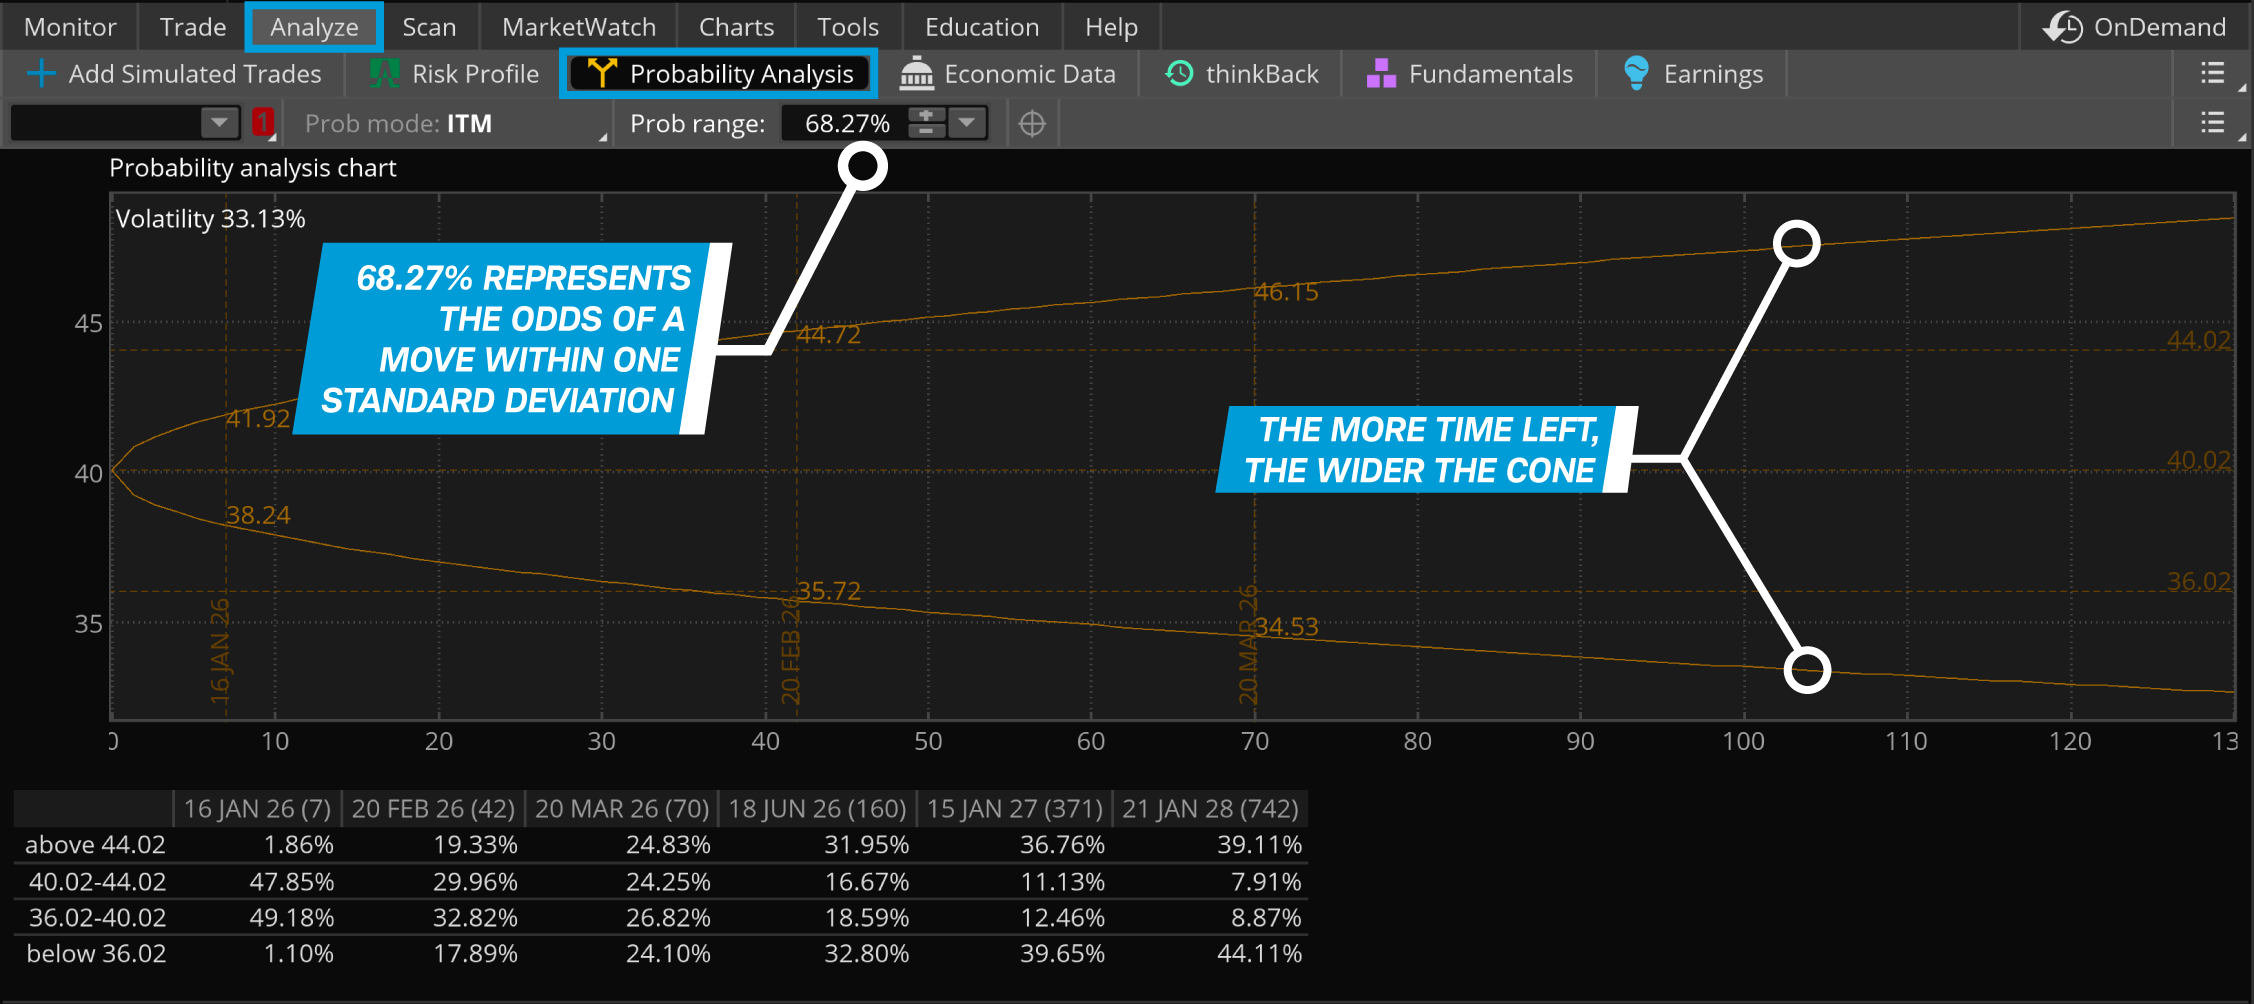
Source: thinkorswim platform
Traders using this feature can adjust the range to show probabilities based on two or three standard deviations because financial markets often exhibit "fat tails"—moves beyond one or two standard deviations—more often than a log-normal distribution would suggest.
How to calculate implied volatility
IV is one of six factors that determine the price of an option, but five other factors must be calculated first. They are:
- Current (underlying) stock price
- Strike price
- Days until expiration
- Risk-free interest rate
- Expected dividend yield
Traders calculate IV by plugging the variables above into an options-pricing formula for each strike and expiration.
IV and options prices form a sort of feedback loop. Prices are first used to calculate IV, as shown above, but then traders also use IV to decide what they're willing to pay for options. Both prices and IV can shift as market sentiment and conditions change.
Historical volatility
Historical volatility (HV) is a measure of a stock's volatility over a specific time frame in the past, such as 20, 30, or 50 days. HV itself looks backward only, but traders use it to inform their expectations of future volatility, even though past performance doesn't guarantee future results.
Comparing HV and IV using metrics, such as IV rank and IV percentile, can help traders understand how current IV compares with IV levels over the past year, and thus how it is being priced into options (see image below).
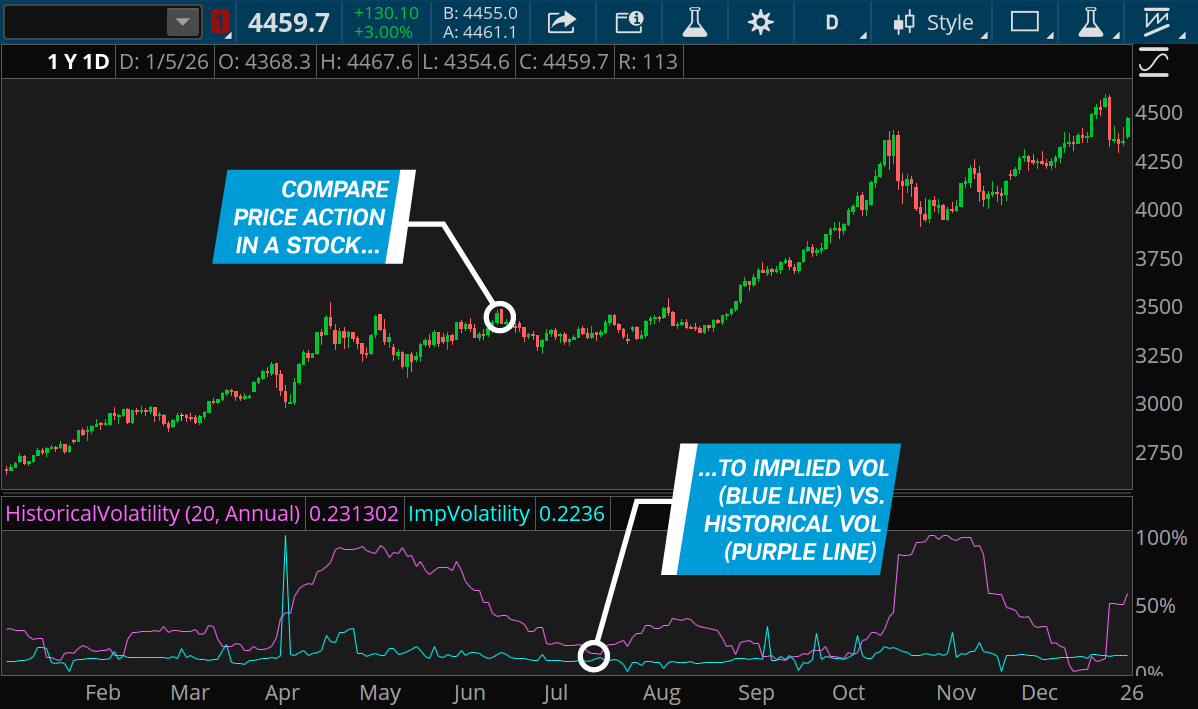
Source: thinkorswim platform
Generally speaking, and all else being equal, when IV is higher than HV, options are relatively expensive, while IV sitting below HV suggests options are relatively inexpensive. However, because markets are forward-looking and somewhat efficient, a disparity between IV and HV doesn't necessarily mean the market has mispriced the options. The market could have excellent reasons for expecting the volatility of the underlying stock to be different going forward than it was in the past. And IV typically includes a risk premium, so it's best to compare IV with expected future realized volatility, not HV alone.
Using IV in options trading
Though IV is usually a secondary factor in trading decisions (and sometimes not a factor at all), traders can use it in multiple ways, including assessing current options prices, deciding on a specific options strategy, timing entry and exit points, and trading potential market-moving events.
Assessing price: Option traders often use IV to determine whether the price of an option is high or low at that level of expected volatility. This is where IV often influences price. Some traders adjust what they're willing to pay or accept as payment for an option based on IV.
Strategy selection: IV could influence the choice of whether to buy or sell options. In periods of high IV, some traders may consider selling strategies like covered calls, cash-secured puts, or credit spreads. On the other hand, during periods of low IV, some traders may consider buying strategies like long calls or puts or debit spreads.
In many cases, traders may find IV a useful indicator because, as with asset prices, it can exhibit mean-reverting behavior. In other words, it sometimes strays far away from its previous average, whether higher or lower, and then reverts to the average, though this often depends on the underlying asset and market environment. That means extreme levels might point to a reversal, potentially indicating whether volatility is about to increase or decline.
This can help a trader choose a strategy. When IV is high and falling, such as after a scheduled event that didn't move the market as expected, some traders may consider shorting options in what is known as a short vega trade, a strategy designed to profit from a drop in volatility. On the other hand, if the IV is low and rising, some traders may consider going long on an option to gain positive exposure to volatility (a long vega trade).
Assessing market sentiment toward event risk: IV of an option may rise above its average reading ahead of potentially market-moving events, such as earnings announcements, the release of important economic data, Federal Reserve meetings, or company-specific news like a ruling on a new drug, product announcement, or a shareholder vote on a merger or acquisition. Assessing the magnitude of the change in IV can help a trader assess market expectations. But IV should be a secondary consideration after factors, such as directional exposure, skew, tail risk, and term structure.
Bottom line
When considering options strategies, a trader may potentially enhance their research by aligning a directional opinion with volatility expectations. At the very least, comparing current IV to past and historical volatility may potentially offer a better understanding of whether the market is implying an increase or decrease in an underlying stock's future volatility. And that can, in turn, inform the choice of options strategy.