Charting Seasonality in thinkorswim® desktop

The sayings "as January goes, so goes the year" and "sell in May and go away" do not predict market moves, but they do help explain the concept of stocks' seasonality. Here's how traders can look for possible seasonal stock trends using Schwab's thinkorswim® trading platform.
To get started, log in to the thinkorswim desktop app.
Ready
Source: thinkorswim® desktop platform for Mac.
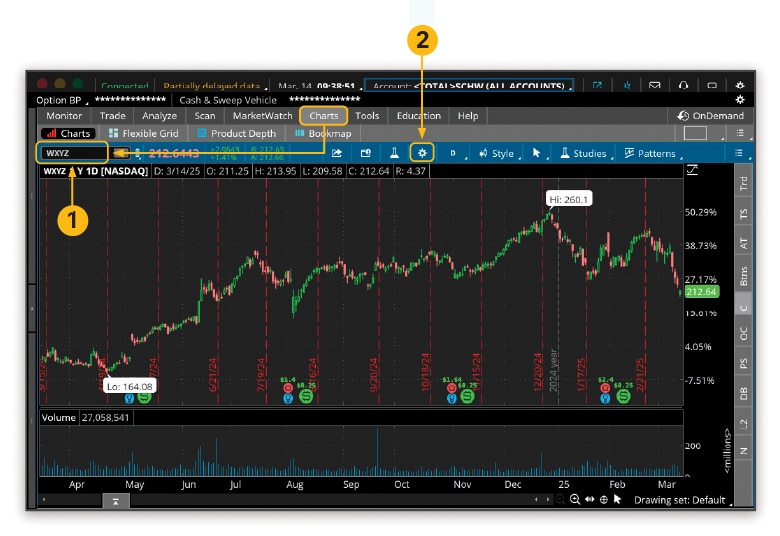
Step 1
From Charts, enter the ticker of the stock you're researching in the search box.
Step 2
Once the chart has populated, click the Charts gear icon to open Chart Settings.
Set
Source: thinkorswim® desktop platform for Mac.
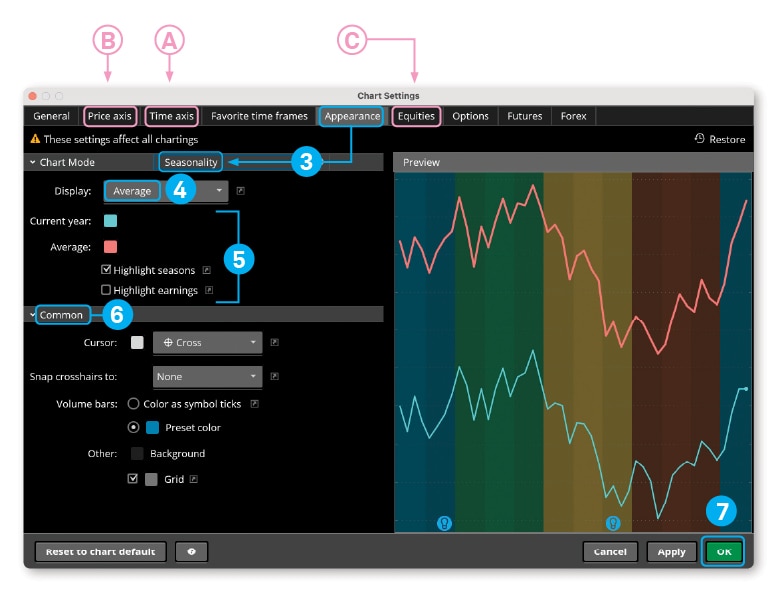
Step 3
In Chart Settings, click Appearance. Next to Chart Mode, click Standard to select Seasonality in the drop-down menu.
Step 4
From the Display drop-down, choose from:
- Yearly, which displays year-to-date performance plus the past five years of performance.
- Average, which displays year-to-date performance plus the average performance over the past five years.
- Yearly + Average, which displays year-to-date performance, the past five years of performance, and the average performance over the past five years.
Tip:
To view different time frames, click Ⓐ Time axis and select a new Time interval.
Step 5
If desired, adjust the colors for the Current year and Average lines on the chart. You can also choose to Highlight seasons or Highlight earnings to make seasonal patterns easier to identify.
Step 6
Under Common, you can further customize the look of your chart's background, cursor, and volume displays.
Tip:
Depending on your needs and preferences, you can refine your seasonality chart within Chart Settings by:
- Customizing the axis: If you'd like all the lines to have the same point of origin—which can make it easier to spot trends—under Ⓑ Price axis, select Display: Show as a percentage and Show bubbles as percentage.
- Displaying available corporate actions: To add earnings, earnings calls, and dividends, under Ⓒ Equities, select Show corporate actions.
Step 7
When satisfied with your selections, click OK to apply the changes and view your chart.
Go
Source: thinkorswim® desktop platform for Mac.
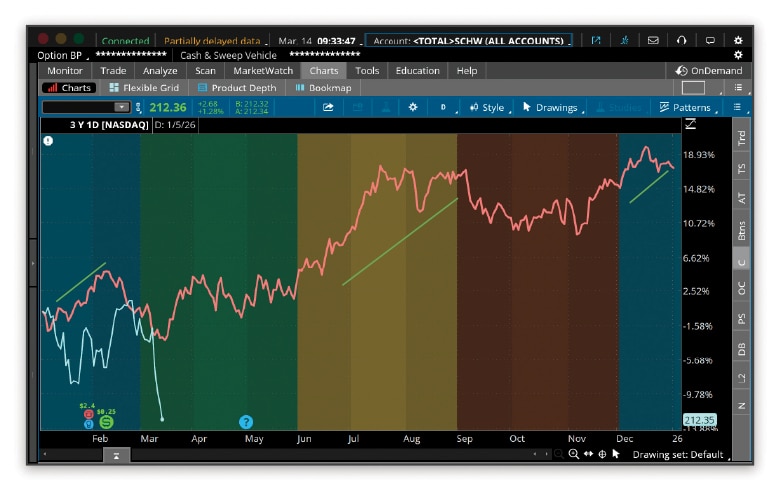
In this example, a hypothetical company's 5-year average (red line) shows that in the past the stock price had tended to increase in December and January, and again throughout most of the summer. Although seasonality, like other technical trading concepts, is not predictive, a trader who believes the stock will continue in this vein might choose to open positions early on in these two cycles and close them out before their historical dips.
Learn more about using thinkorswim trading platform features or schedule a call with a Trading Solutions specialist.
Discover more from Onward

Keep reading the latest issue online or view the print edition.