Credit vs. Debit Spreads: Let Volatility Guide You
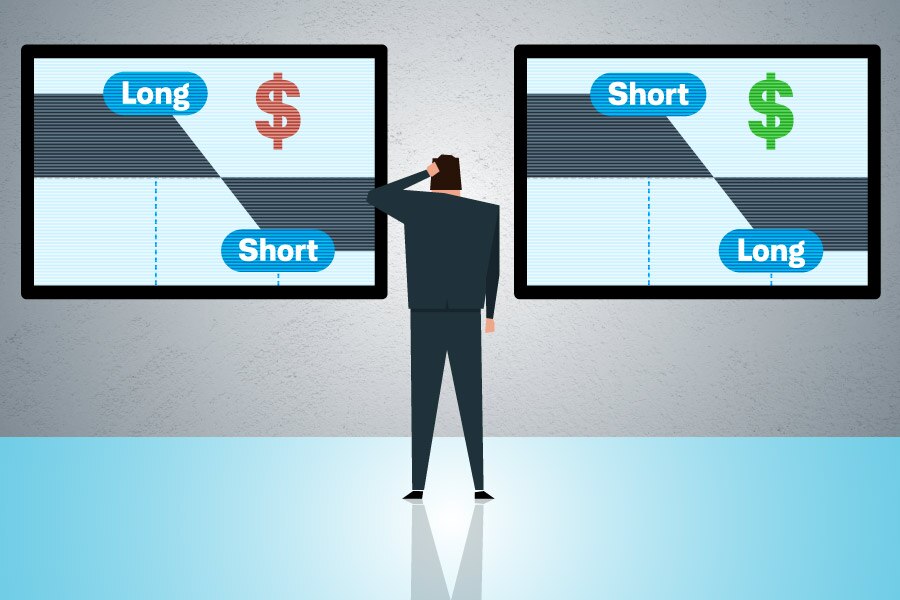
Vertical spreads are among the first strategies many option traders learn because they're relatively straightforward and typically have defined risk and return possibilities. There are two types of vertical spreads: credit spreads1 and debit spreads2. But many traders struggle to choose one over the other. While the forecast for the underlying stock price is often the primary consideration, traders shouldn't overlook the level and direction of implied volatility3 (IV) when deciding between these two spreads.
Credit spreads vs. debit spreads: Too high or too low?
Traders often start by identifying the level of IV, which plays a crucial role in the pricing of options. When IV is relatively high, options tend to be expensive, and some traders prefer credit strategies to maximize the premium received. When IV is relatively low, options prices tend to be cheaper, and—you guessed it—some traders prefer to buy options to minimize cost, excluding transaction fees. Keep in mind, however, volatility can always go higher or lower. This is why it can be helpful to put volatility in the context of IV percentiles, which compares current IV to past highs and lows, typically in the 52-week range.
IV levels for an underlying stock can be found on the thinkorswim® platform under the Analyze or Trade tab. Look at Today's Options Statistics, found below the Option Chain. There are several volatility stats listed here, and each has its benefits and uses (see figure below). For now, we'll focus on IV and IV percentiles.
As a general rule, some traders consider buying a debit spread when IV is between the 0 to 50th percentile of its 52-week range. That's because spreads tend to be less expensive when IV is low.
Example of daily options statistics from thinkorswim platform
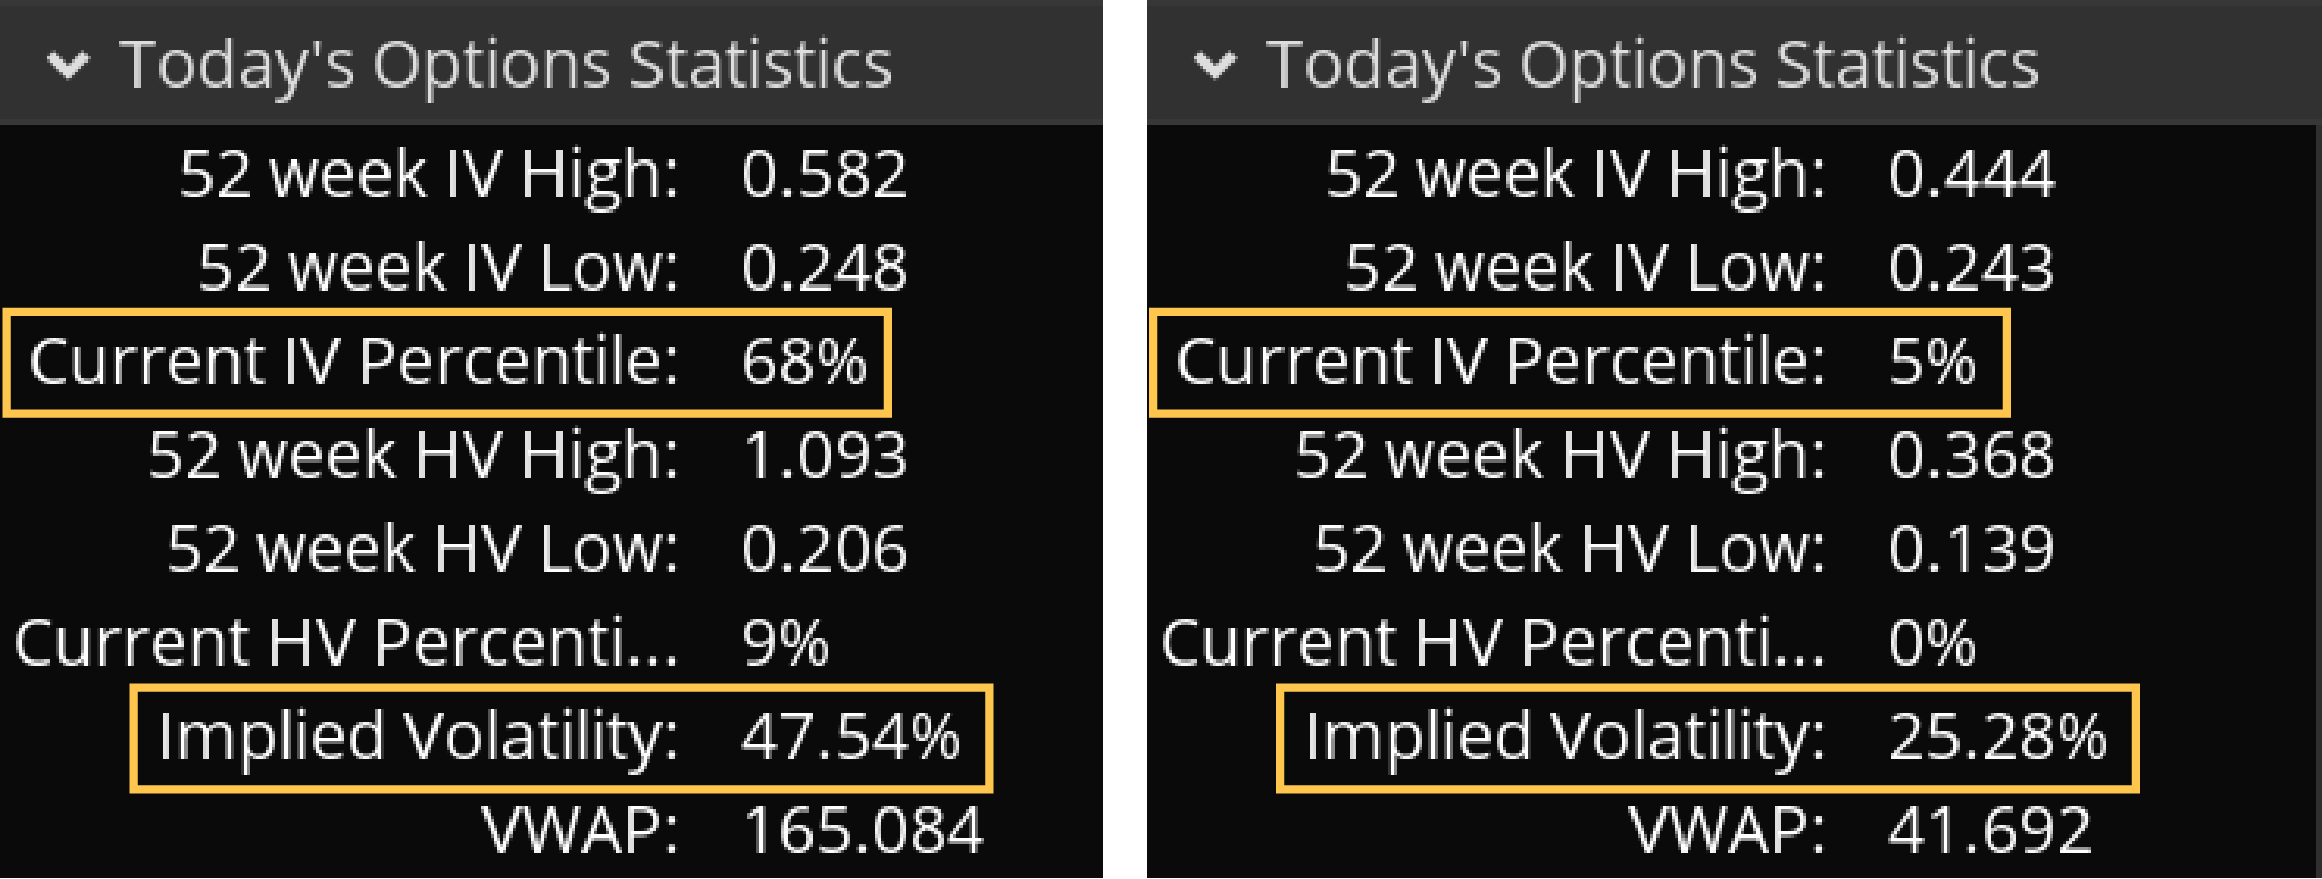
thinkorswim® platform
For illustrative purposes only. Past performance does not guarantee future results.
IV isn't necessarily cheap or expensive until you compare it to its own trading percentile range. Some traders prefer selling a credit spread when IV is greater than the 50th percentile of its 52-week range.
The direction of volatility
Now let's talk about the direction of implied volatility. Direction matters because options trades are exposed to changes in IV—also known by its options greek term vega—for the duration of the trade.
Debit spreads typically have positive vega and benefit when IV rises over time. All else being equal, an increase in IV could provide the opportunity to sell the spread for more than the debit. By contrast, credit spreads typically have negative vega and benefit when IV falls over time. This makes sense, because as IV falls, options can become less expensive and are cheaper to buy back.
However, because vertical spreads involve both long and short options, some gains (or losses) from changes in IV in one contract will likely be offset by losses (or gains) from changes in IV of the other. The net vega of the spread can serve as a rough estimate to help understand how much IV will help or hurt the position, but other factors—such as changes in the underlying stock price, how much time has passed, the bid/ask spread, and transaction fees—will also affect the outcome of the trade.
As another general rule, some traders prefer buying debit spreads when IV is low and rising, although there is no guarantee that IV will continue rising. Likewise, some traders prefer selling credit spreads when IV is high and falling. To view implied volatility on a price chart on thinkorswim, from the Charts tab, select Studies > Add Study > Volatility Studies > ImpVolatility (see figure below).
Stock chart with IV indicator on thinkorswim platform
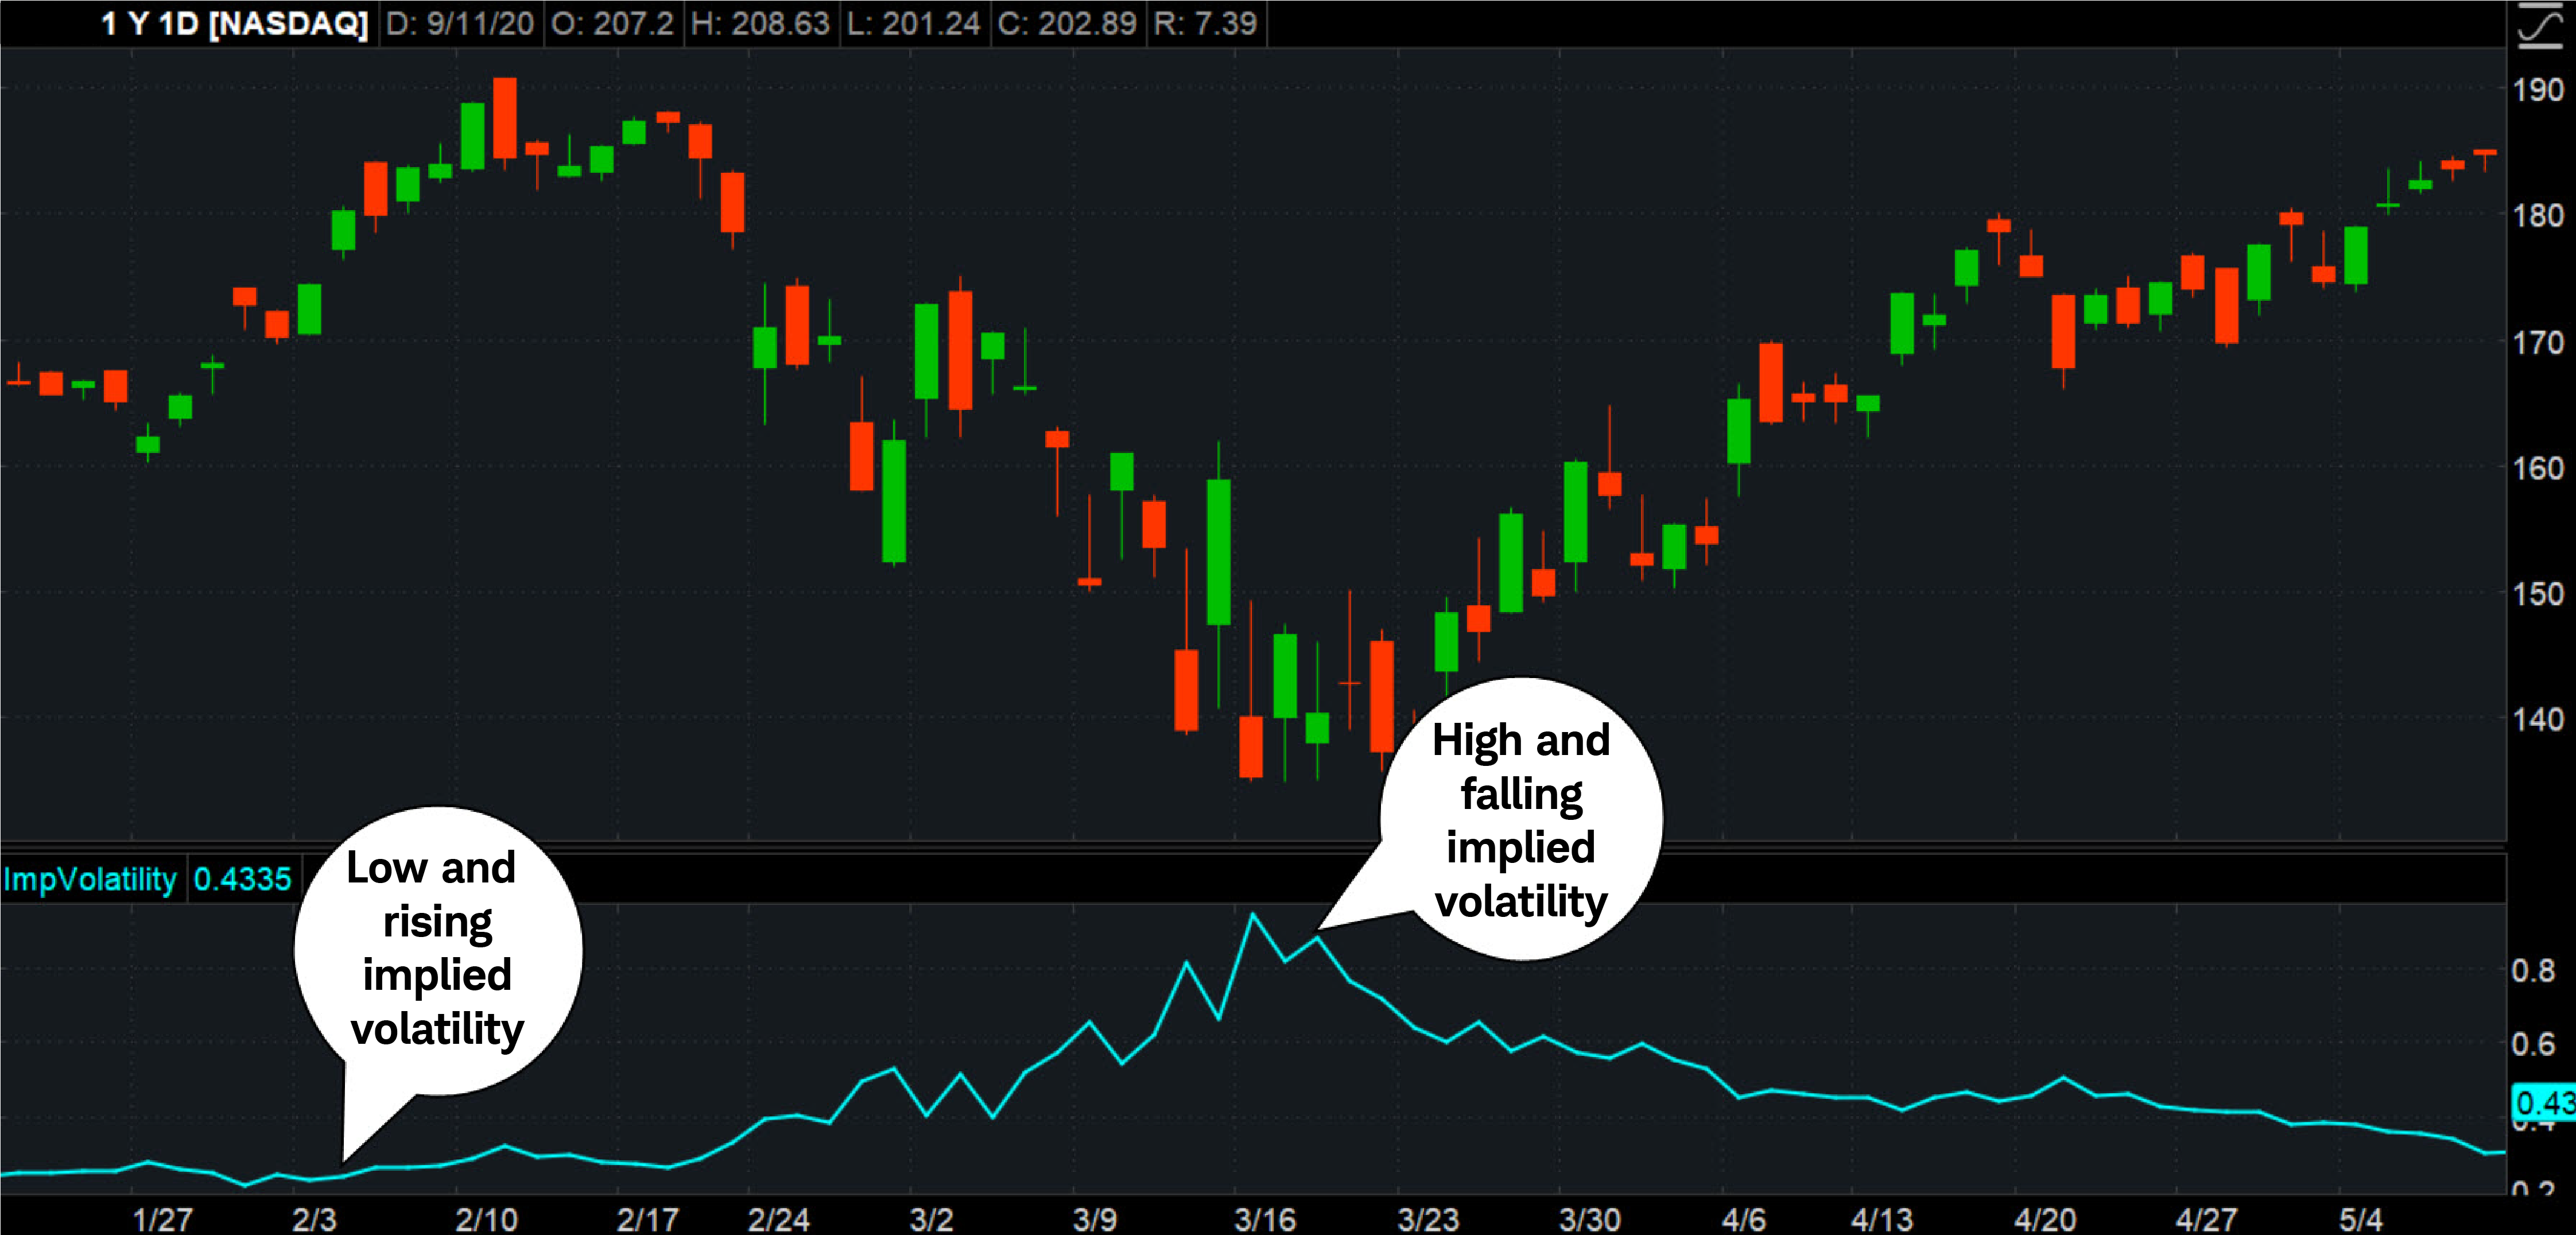
For illustrative purposes only. Past performance does not guarantee future results.
It's worth pointing out there are countless ways to construct vertical spreads with various strike prices, expirations, and IV levels. A lot depends on a trader's forecast for the timing and movement of the underlying stock. Generally, traders often use debit spreads in anticipation of a move higher or lower in shares, and they tend to use credit spreads to collect premium.
The bottom line, all else being equal, is that tracking the level and direction of IV can sometimes help traders decide between credit and debit spreads, as well as show how changes in volatility can influence the value of a spread.
1A vertical credit spread is the simultaneous sale and purchase of options contracts of the same class (puts or calls) on the same underlying security within the same expiration but different strike prices. A put vertical credit spread is the sale of a put and the purchase of a put with a lower strike price. A call vertical credit spread is the sale of a call and the purchase of a call with a higher strike price.
2A vertical debit spread is the simultaneous purchase and sale of options contracts of the same class (puts or calls) on the same underlying security within the same expiration but different strike prices. A put vertical debit spread is created by buying a put and selling a put with a lower strike price. A call vertical debit spread is the purchase of a call and the sale of a call with a higher strike price.
3Expressed as a percentage and computed using a theoretical options-pricing model, implied volatility reflects the market's perception of an underlying asset's future volatility.