Factor Investing: Looking Beneath the Market

Key takeaways
- Factors offer an additional lens for analyzing and investing in equity markets. Rather than allocating primarily through traditional market-cap-weighted regional or sector indices, factor investing groups and weighs stocks based on shared characteristics like valuation, price and earnings momentum, profitability, balance sheet health, size, and price volatility. This provides a more targeted way to understand and express the underlying drivers of risk and return.
- Factors can reveal what's driving markets beneath the index or sector level. An analysis that isolates common stock characteristics can help investors distinguish factor effects from broader sector moves, identify intended or unintended portfolio exposures, and better understand sources of performance.
- Factor leadership changes as market and economic conditions evolve. Value, growth, momentum, quality, and other characteristics can all perform differently across environments, making factors useful—both as a framework for monitoring market leadership and as building blocks for expressing investment views. However, we recognize that factor timing, like market timing, can lead to poor outcomes.
- We discuss a new framework that tracks eight U.S. factors: Growth, Liquidity, Volatility, Momentum, Quality, Size, Value, and Yield.
How can factors complement traditional equity investing?
An equity factor is a measurable characteristic that can be used to group, compare, or weight companies. Examples include valuation, earnings growth, profitability, price momentum, market capitalization, trading liquidity, dividend yield, and price volatility. Factor strategies systematically emphasize one or more of these characteristics.
Investors have traditionally viewed the stock market through a few familiar lenses. Stocks are often grouped by geography (or country of domicile), the sectors and industries in which they operate, or their size. Factor groupings offer a way to look at the market based on the underlying characteristics that stocks share, rather than where they fit within a traditional index.
Factor-based investing has been around for a long time, with roots in valuation-oriented methodologies. Common factor characteristics include valuation, growth, price momentum, profitability, balance-sheet strength, size, and volatility. Organizing stocks this way can give investors a more targeted view of the underlying drivers of risk and return. It can also complement traditional stock analysis by helping investors understand not just what they own, but some of the characteristics they are exposed to by owning it. Factor-based portfolios deliberately depart from market-cap weights, with the resulting exposure depending on how the factor is defined and constructed.
Consider two companies in completely different industries. A technology company and a health care company may have little in common from a sector perspective, but both could have strong earnings growth and rising share prices. Likewise, a bank and an industrial company could both trade at relatively inexpensive valuations. A sector lens separates those companies. A factor lens groups them by their shared characteristics.
Factor analysis can help explain what's happening beneath the surface of an index or sector. A market advance that appears broad, for example, may be disproportionately rewarding companies with strong momentum or growth characteristics. Similarly, a portfolio diversified across many sectors may have large relative exposure to valuation, size, or profitability-based factors. Measuring those exposures can help investors better understand their portfolio exposures and performance. Historically, active portfolio managers have often used factor analysis for precisely this kind of risk management and performance attribution.
Factor analysis doesn't replace traditional equity analysis. It's another lens that can help investors see what may be driving returns beneath the index or sector level and identify exposures that traditional classifications may not reveal.
How did we build our factor framework?
A factor's name doesn't tell investors everything they need to know. Definitions, stock selection, weighting, rebalancing, starting universe, and sector exposure can cause two investment strategies bearing the same label to have very different underlying characteristics and produce different returns.
Schwab's U.S. equity factor framework begins with the S&P 500 and ranks each company within its respective sectors on various characteristics. We then aggregate the highest-ranked quintile (top 20%) across all sectors. This sector-neutral process is intended to isolate the selected characteristic, rather than reproduce an unintended sector allocation.
Comparing stocks with others in the same sector can help separate the effect of a characteristic from the performance of the sector itself. This matters because accounting measures and valuations can differ substantially across industries. Without adjusting for these differences, what looks like a Value or Quality signal may have a large sector tilt. Ranking companies against sector peers reduces that distortion, but it doesn't eliminate all sector effects.
The 8 Schwab U.S. equity factors
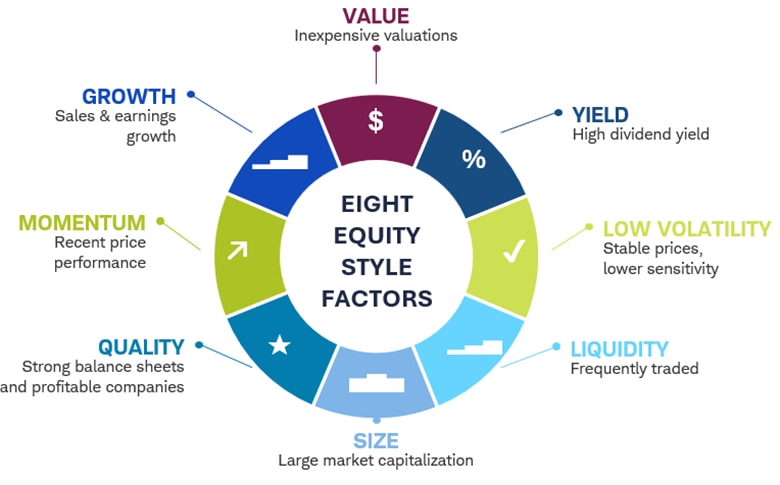
Source: Schwab Center for Financial Research.
Factor definitions are simplified for educational use. For illustrative purposes only. Not intended to be reflective of results you can expect to achieve and should not be used as a basis for an investment decision.
The 8 Schwab U.S. equity factors and potential advantages and disadvantages
- Factor
- What it means
- Potential advantages
- Potential disadvantages
-
FactorGrowthWhat it meansStrong sales and earnings growthPotential advantagesStronger growth could drive returns over the long termPotential disadvantagesHigh expectations and interest rate sensitivity
-
FactorLiquidityWhat it meansStocks that trade frequently and easilyPotential advantagesLower trading friction and greater market depthPotential disadvantagesCan favor larger, widely owned stocks
-
FactorVolatilityWhat it meansVolatile prices and higher market sensitivityPotential advantagesCan outperform during risk-on ralliesPotential disadvantagesTypically underperforms in market declines
-
FactorMomentumWhat it meansStrong recent price performancePotential advantagesFollows persistent leadershipPotential disadvantagesVulnerable to abrupt reversals
-
FactorQualityWhat it meansStrong profitability, low debt, durable earningsPotential advantagesDurable businesses and financial resiliencePotential disadvantagesCan become expensive or have lower growth
-
FactorSizeWhat it meansMarket capitalizationPotential advantagesScale, access to capital, and analyst coveragePotential disadvantagesCan lag when recoveries broaden
-
FactorValueWhat it meansLow valuation ratiosPotential advantagesRoom for valuation expansionPotential disadvantagesValue traps and long underperformance periods
-
FactorYieldWhat it meansHigh-dividend yieldsPotential advantagesHigher income component to returnsPotential disadvantagesSlower growth and competition from bonds
What do the specific factors measure?
Growth
The Growth factor favors companies with strong sales and earnings trends. This factor has tended to perform well during periods of economic expansion and/or when there are wide growth differentials across equities. As we've seen in recent years, sustained strong earnings growth from certain stocks or industries can lead to persistent Growth outperformance.
Interest rates are relatively important for growth-oriented stocks because a larger share of a company's estimated value may depend on earnings expectations that are further in the future. The trade-off is embedded expectations: strong anticipated growth might already be reflected in the stock price, leaving less room for disappointment.
Earnings expectations for the Growth factor have outpaced the rest in recent years
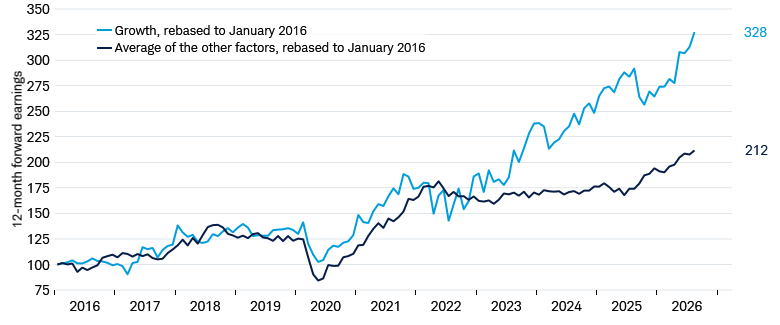
Source: Schwab Center for Financial Research, MSCI, and Macrobond.
Monthly data from January 1, 2016 through September 30, 2026. Forecasts contained herein are for illustrative purposes only, may be based upon proprietary research and are developed through analysis of historical public data.
Liquidity
Liquidity measures how easily a stock can be bought or sold. Stocks with higher liquidity generally have larger trading volume and lower bid/ask spreads (the difference between the highest price a buyer is willing to pay and the lowest price a seller is willing to accept). Liquidity may become particularly important when uncertainty rises and investors value the ability to adjust positions. However, in periods of acute volatility, more liquid stocks can be sold more easily than stocks with poor liquidity, even if they are higher quality. Because larger companies tend to trade more actively, Liquidity and Size factor portfolios can have relatively high degrees of overlap, meaning the same stock can be in both factor buckets.
Volatility
Volatility groups stocks with high historic price and/or earnings volatility and higher sensitivity to broad market movements. It's most common that investors choose to add Low Volatility strategies (Low Vol) rather than High Volatility (High Vol) ones. Low Vol stocks may offer defensive characteristics and have often declined less during broad market weakness, as the chart below shows, but they may lag when more speculative or economically sensitive stocks rally.
Low Vol stocks have historically outperformed the broader market during most drawdowns
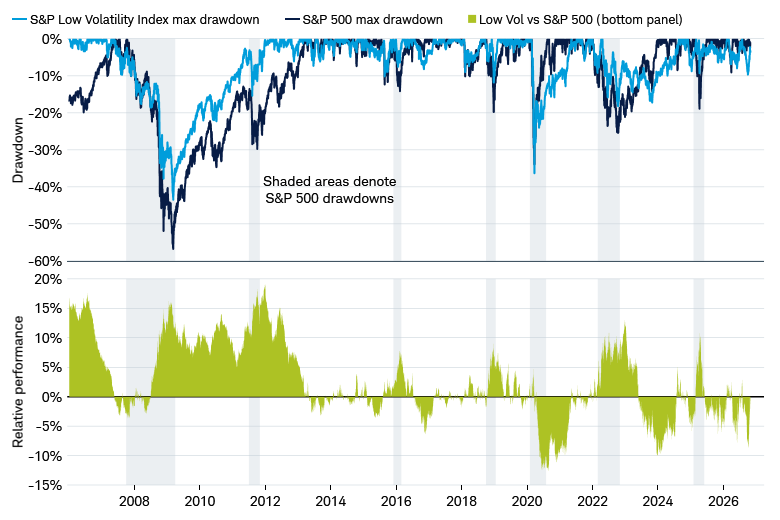
Source: Schwab Center for Financial Research, MSCI, and Macrobond.
Data from January 31, 2006 through September 30, 2026. Indexes are unmanaged, do not incur management fees, costs, and expenses, and cannot be invested in directly. For more information on indexes, please see schwab.com/indexdefinitions. For illustrative purposes only. Not intended to be reflective of results you can expect to achieve and should not be used as a basis for an investment decision. Past performance is no guarantee of future results.
Momentum
Momentum favors stocks with strong recent price performance. It reflects the tendency of market trends to persist as investors gradually respond to new information and chase recent winners. Momentum can be powerful while leadership remains stable. It can also reverse abruptly, particularly near market turning points or after crowded trades unwind. Relatively rapid changes in leadership can create a whipsawing effect, whereby market leadership changes rapidly, and potentially lead to Momentum underperformance. These changes have led to bouts of general market volatility over the past 25 years. The chart below shows the relative performance of the MSCI USA Momentum Index against the S&P 500 Equal Weight Index and the CBOE Volatility Index (VIX), which measures volatility implied by the options market.
Spikes in the VIX have historically been accompanied by periods of Momentum underperformance
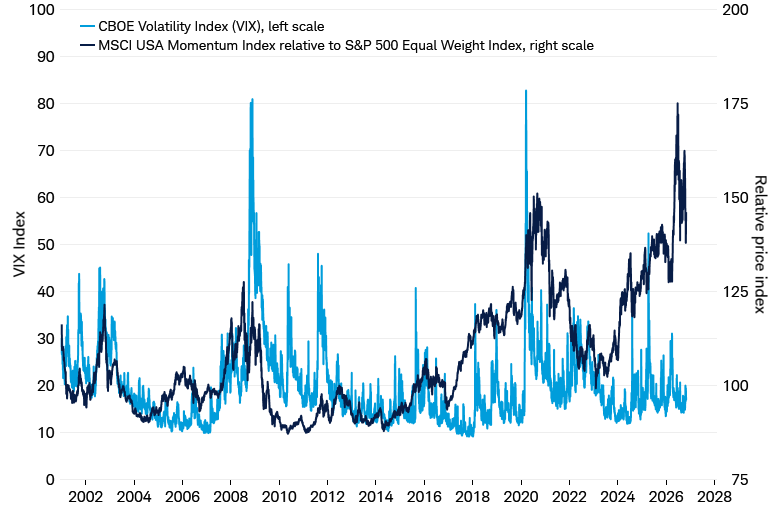
Source: Schwab Center for Financial Research, MSCI, S&P Global, and the Chicago Board Options Exchange (CBOE).
Data from 1/1/2001 to 10/20/2026. Indexes are unmanaged, do not incur management fees, costs, and expenses, and cannot be invested in directly. For more information on indexes, please see schwab.com/indexdefinitions. Past performance is no guarantee of future results.
Quality
Quality emphasizes profitable, financially strong, and relatively stable companies. Common measures include profitability, leverage, and earnings consistency. These characteristics may become more valuable when economic risk increases. Financial strength, however, doesn't determine whether a stock is attractively priced. The chart below plots the return on equity (ROE) of Quality against other common factors and shows its higher profitability. It also shows how the Value factor has the lower profitability. Weak profitability can partly explain low valuation.
The Quality factor has stronger profitability, but the gap has narrowed over the last 2 years
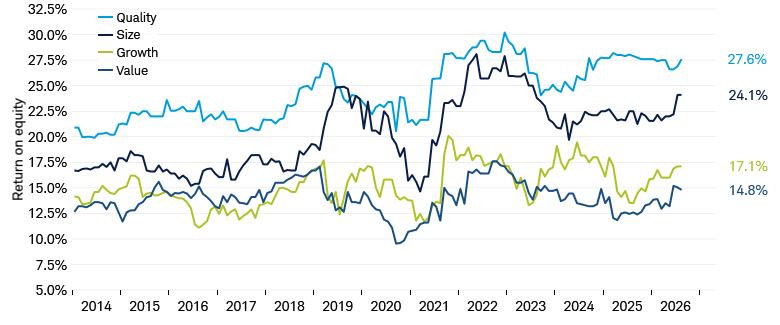
Source: Schwab Center for Financial Research, data from 1/1/2014 to 10/20/2026.
ROE is a measure of profitability that can be measured by dividing net income by shareholder equity. For illustrative purposes only. Not intended to be reflective of results you can expect to achieve and should not be used as a basis for an investment decision. Past performance is no guarantee of future results.
Size
Schwab's Size factor is based on market capitalization. Currently, the median market cap of the largest quintile, or top 20%, is almost 14 times larger than the median market cap of the smallest quintile, or bottom 20%, as shown in the chart below. Our research shows large companies typically have broader access to financing, more analyst coverage, and more diversified operations. Smaller companies may lead when economic growth broadens and credit is readily available. Larger companies may hold an advantage when financing conditions tighten or investors place a premium on earnings visibility.
The median market cap of the largest Size quintile is almost 14x the median of the smallest quintile
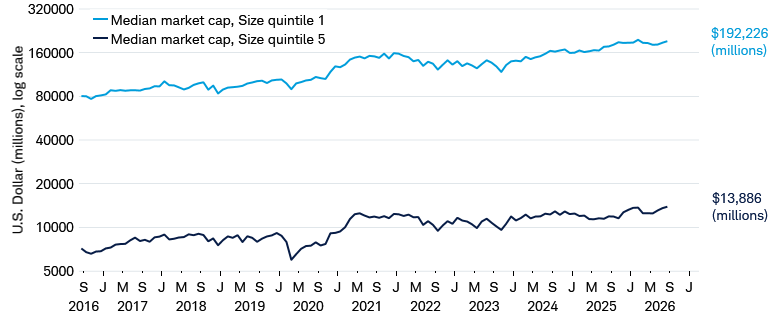
Source: Schwab Center for Financial Research, data from 9/30/2016 to 9/30/2026, as of 10/20/2026.
Log of market cap is used to compress the extreme range of company size to reduce the influence of outliers. For illustrative purposes only. Not intended to be reflective of results you can expect to achieve and should not be used as a basis for an investment decision. Past performance is no guarantee of future results.
Value
The Value factor seeks stocks trading at low prices relative to fundamentals like earnings, cash flow, or sales. Low stock valuations can create opportunity when expectations are too pessimistic, pushing the prices investors are willing to pay downward. But low valuations can also reflect real financial deterioration, and in such cases, a low valuation could be warranted.
Detailed analysis of a company's financial health and growth outlook may help distinguish between those stocks that are mispriced by the market and those whose valuations reflect deteriorating company fundamentals (often referred to as a "value trap"). Using several valuation measures and comparing companies with sector peers may reduce the risk of buying a value trap, but it cannot eliminate it.
Value's P/E ratio is nearly half of Growth's
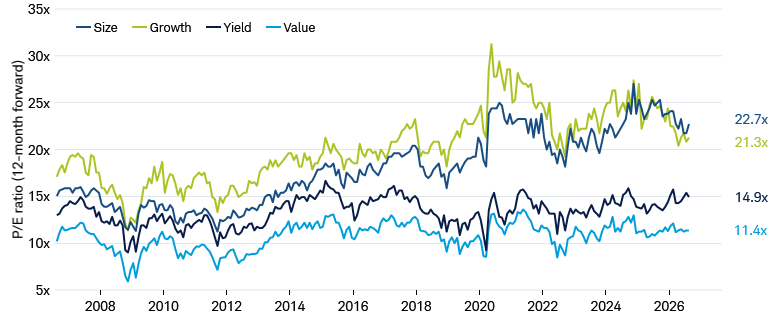
Source: Schwab Center for Financial Research.
Data from 10/20/2006 to 10/20/2026. This hypothetical example is only for illustrative purposes. Not intended to be reflective of results you can expect to achieve and should not be used as a basis for an investment decision. Past performance is no guarantee of future results.
Yield
Yield favors companies with relatively high dividend yields. It can appeal to investors seeking higher current income or businesses with mature, but stable, cash-flow profiles. A high dividend yield is not automatically attractive. It may result from a falling stock price and could indicate that the market is pricing in financial deterioration. Growth prospects, balance-sheet strength, free cash flow generation, and dividend payout sustainability remain important.
The Yield factor currently offers the highest dividend yield among the factor baskets
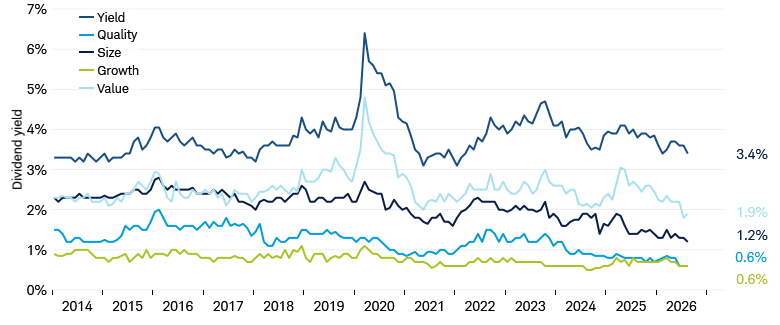
Source: Schwab Center for Financial Research, data as of 10/20/2026.
For illustrative purposes only. This hypothetical example is only for illustrative purposes. Not intended to be reflective of results you can expect to achieve and should not be used as a basis for an investment decision. There are risks associated with investing in dividend paying stocks, including but not limited to the risk that stocks may reduce or stop paying dividends. Past performance is no guarantee of future results.
What is recent factor performance telling investors?
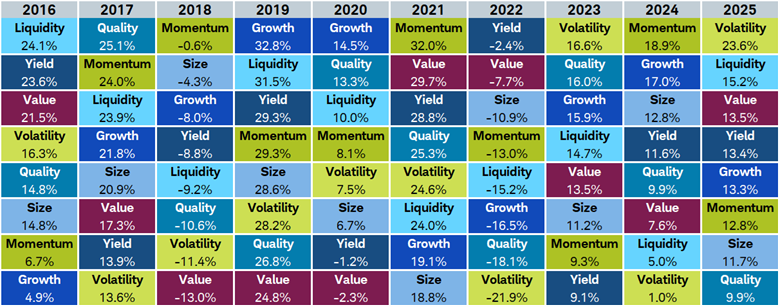
The return "quilt" shown below ranks factors by performance each year and illustrates the point that factor leadership changes quite often.
"The Factor Return Quilt" shows how factor leadership varies from year to year
Source: Schwab Center for Financial Research and Macrobond.
Data as of 10/20/2026. This hypothetical example is only for illustrative purposes. Not intended to be reflective of results you can expect to achieve and should not be used as a basis for an investment decision. There are risks associated with investing in dividend paying stocks, including but not limited to the risk that stocks may reduce or stop paying dividends. Past performance is no guarantee of future results.
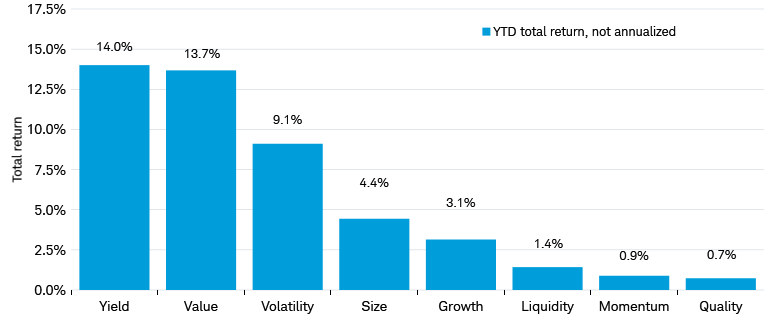
Yield and Value have outperformed this year after lagging over the last 10 years
Source: Schwab Center for Financial Research, MSCI, and Macrobond.
Data as of 10/20/2026. This hypothetical example is only for illustrative purposes. Not intended to be reflective of results you can expect to achieve and should not be used as a basis for an investment decision. There are risks associated with investing in dividend paying stocks, including but not limited to the risk that stocks may reduce or stop paying dividends. Past performance is no guarantee of future results.
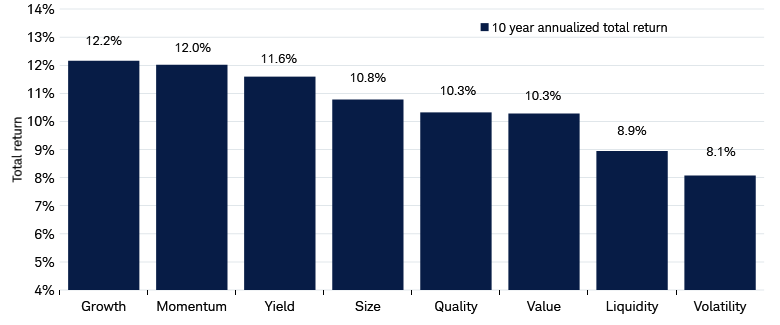
Growth and Momentum have outperformed other factors over the last 10 years
Source: Schwab Center for Financial Research and Macrobond, data as of 10/20/2026.
For illustrative purposes only. Not intended to be reflective of results you can expect to achieve and should not be used as a basis for an investment decision. Past performance is no guarantee of future results.
The outperformance of Growth and Momentum reflects, in part, the strong, sustained earnings growth and performance of large-cap Tech and Communication Services companies that have taken market share and delivered strong profitability over the last decade. In our view, the more recent performance of Value and Yield suggests to us the market is shifting its focus to potentially less-crowded parts of the market.
While performance trends and changes can reveal what the market has rewarded and how it might be changing, it doesn't establish what will lead next.
How can the business cycle affect factor leadership?
There are many ways to measure the business cycle, each of which has its own strengths and weaknesses. However, it's helpful to understand how markets have historically behaved under various conditions. Factor performance trends have displayed some relatively intuitive patterns.
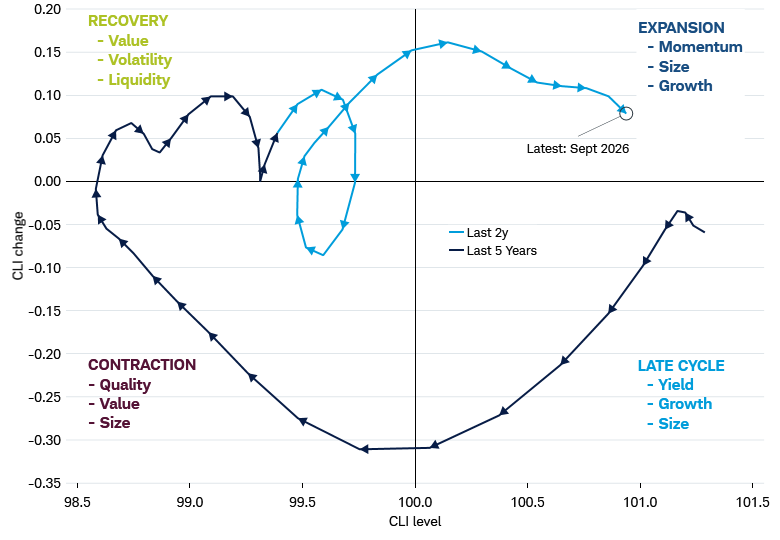
Our analysis shows, more risk-seeking characteristics, like volatility, small cap, and value, have tended to outperform in early-cycle or recovery periods. More defensive characteristics, like stable earnings, low price volatility, and high dividend yield, have historically outperformed during economic slowdowns and recessions.
The chart below uses the level and change of the Organisation for Economic Co-operation and Development's (OECD's) U.S. Composite Leading Indicator (CLI) as a proxy for a business cycle indicator. We have listed three factors in each phase of the cycle that have tended to perform well in our analysis.
Factor leadership tends to shift across business cycle phases
Source: Schwab Center for Financial Research and OECD, data from September 2021 through September 2026.
Composite Leading Indicator (CLI) is an index designed to provide early signals of turning points in business cycles, showing fluctuation of the economic activity around its long-term potential level. The arrows show the direction of movement.
How factors have historically performed across economic cycle phases
- Factor
- Tends to do better when:
- Tends to lag when:
-
FactorGrowthTends to do better when:Earnings growth gaps between stocks/sectors widen; rates fallTends to lag when:Earnings growth gaps narrow; rates rise
-
FactorValueTends to do better when:Valuations diverge; economic activity expandsTends to lag when:Market leadership narrows around a set of stocks/sectors
-
FactorMomentumTends to do better when:Existing market trends persist; low volatilityTends to lag when:Market leadership changes; increased volatility
-
FactorSizeTends to do better when:Large caps tend to outperform small when economic activity narrows, credit conditions tightenTends to lag when:Economic activity broadens; credit conditions ease; risk appetite improves
-
FactorQualityTends to do better when:Uncertainty rises; investors seek safety and durabilityTends to lag when:Speculation and risk-taking rise
-
FactorYieldTends to do better when:Growth slows; investors seek income and defensive exposureTends to lag when:Rates rise; investor speculation increases
-
FactorVolatilityTends to do better when:Strong bull markets; risk appetite increasesTends to lag when:Volatility rises; markets decline
Just as we considered factor performance in business cycle phases, we can also consider them against macroeconomic regimes based on growth and inflation dynamics. In the chart below we plot the last five years of our U.S. Growth and Inflation Indicator, a proprietary indicator that tracks the level and rate of change of economic growth and inflation data, and list the three factors that have tended to perform best in each phase.
This too is an imprecise exercise, and all cycles and regimes have their own idiosyncratic drivers. Based on our measure's latest reading, we're in a relatively subdued high-growth and high-inflation phase. Historically, equity market total returns have been positive in this phase, but the trade-off between strong growth and inflation risk has delivered mixed factor results in our analysis. Stocks with high liquidity, or those with favorable quality, have historically performed well during these periods.
Economic regimes can help investors understand why leadership is changing. However, they are less reliable as precise trading signals.
Factor leadership tends to shift across growth and inflation regimes
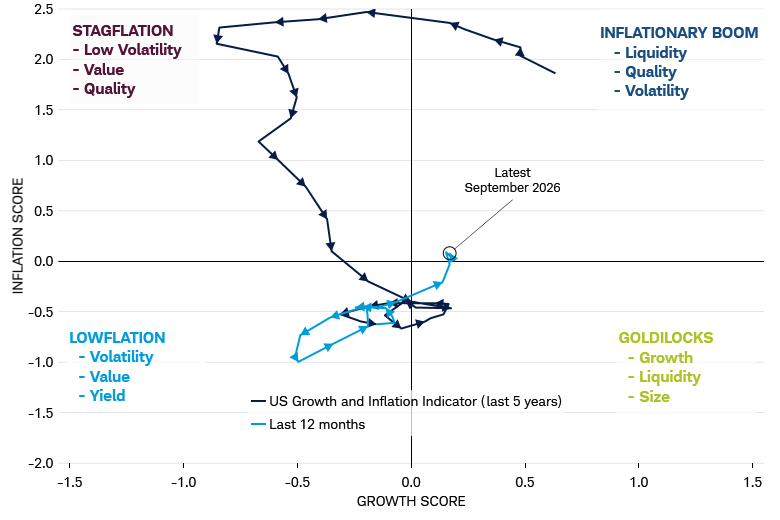
Source: Schwab Center for Financial Research, Bloomberg, and Macrobond.
Data from September 2021 through September 2026. The arrows show the direction of movement.
Factor trends in growth and inflation regime phases
- Macro regime
- Growth/Inflation
- Factor that have performed well
- Why
-
Macro regimeGoldilocksGrowth/InflationHigh growth, low inflationFactor that have performed wellGrowth, Liquidity, SizeWhyImproving earnings and easing inflation can support risk appetite and longer-duration assets.
-
Macro regimeInflationary BoomGrowth/InflationHigh growth, high inflationFactor that have performed wellLiquidity, Quality, VolatilityWhyBroader demand can lift cyclical earnings, while quality and resilience become important with high inflation.
-
Macro regimeLowflationGrowth/InflationLow growth, low inflationFactor that have performed wellVolatility, Value, YieldWhyLow interest rates support Yield while trade-offs with low growth can result in mixed results.
-
Macro regimeStagflationGrowth/InflationLow growth, high inflationFactor that have performed wellLow Volatility, Yield, QualityWhyA risk-off dynamic supports Low Volatility and Quality. The defensiveness of Yield can be sought after despite higher rates.
A Goldilocks environment characterized by strong growth and low inflation can be supportive for equities as inflation and interest rate risk tend to be relatively low. This can also support stocks with high dividend yields as bond yields tend to be relatively low.
Stagflationary environments—where high inflation drives interest rates up, but growth remains weak—are historically the most challenging environment for equities. Investors may place greater value on defensive factors like Quality and Low Volatility, while Value can work in an environment where valuation multiples compress.
These relationships are tendencies, not rules. Valuation, market positioning, interest rates, credit conditions, economic changes, and other variables can alter the outcomes.
Why is a macro playbook for factors not a market-timing tool?
Using economic regimes to time factor allocations requires investors to make two difficult judgments correctly: (1) identify the regime; and (2) determine how much of it the market has already priced in. By the time an economic label becomes obvious, markets may have already priced in the different environment.
The business cycle can still provide a useful framework. Early recoveries may reward stocks with high liquidity and greater economic sensitivity. Mature expansions can favor profitable cyclical companies. When growth slows, investors may pay more for dependable earnings and financial strength.
Inflation, valuations, credit conditions, and market positioning can disrupt these patterns. A factor playbook works best to frame questions about the current market environment to help consider whether adding factor exposures can better align a portfolio with objectives.
Questions to ask before adding a factor investment strategy
- Question
- Why it matters
-
QuestionHow is the factor defined?Why it mattersThe same label can use very different signals, lookback periods, and weighting rules.
-
QuestionIs it sector neutral?Why it mattersSector tilts may overwhelm the intended stock characteristic.
-
QuestionWhat is the parent (starting) universe?Why it mattersLarge-cap, small-cap, and global universes create different liquidity and capacity risks.
-
QuestionHow often does it rebalance?Why it mattersFaster updates can keep signals fresh but raise turnover, taxes, and market impact.
-
QuestionWhat other factors are embedded?Why it mattersA Value strategy may carry low-quality exposure; Low Volatility may be expensive; Quality may overlap with Growth.
-
QuestionCan I hold it through a long drought?Why it mattersA sound strategy can still underperform for years. Staying power affects realized returns.
How can investors put factors to work?
Factors can serve three practical purposes.
- Factors can help explain market leadership. If Growth and Momentum lead together, the market may be rewarding persistent earnings trends and price strength. If Quality and Low Volatility lead, the market may be placing greater value on stability and financial resilience.
- Factors can expose hidden portfolio concentrations. A collection of stocks from different sectors may appear diversified while sharing similar Growth, Size, Quality, or Momentum characteristics.
- Factors can help investors compare securities and investment strategies more consistently.
Use Schwab's Stock Screener to find stocks
Schwab clients can use the Schwab Stock Screener to explore individual factor concepts to find stocks.
Screening on the actual U.S. Equity Style factors is not yet available. However, some of the factors can be represented with items found in the Schwab Stock Screener. For example, clients can search dividend yield, which is found in the Dividends category, for Yield; market capitalization, which represents Size, which is found in the Basic section; and the stock’s recent performance, found in Price Performance, can be used to search momentum.
Learn more about how to use the Stock Screener.
The bottom line: No factor wins all the time
Factors can help explain what's driving market leadership, identify characteristics shared across seemingly different holdings, and improve the evaluation of investment strategies. Economic regimes may help explain why factor leadership changes, but they should not be treated as precise forecasts.
The practical value of factor investing is not the promise of finding a permanent winner, it's a clearer understanding of what an investor owns, which risks are concentrated in the portfolio, and how those exposures could behave as financial conditions change.
Momentum can suffer during abrupt reversals. Value can underperform for years. Low Volatility can lag during powerful market advances. Strategies focused on smaller companies can face liquidity, financing, and trading-cost challenges.
These cycles help explain why a diversified factor approach may be more durable than dependence on a single characteristic. Different factors respond to different economic and market forces, so their strongest and weakest periods do not always coincide.
Before pursuing factor strategies, investors should examine the underlying details, including definition, the universe of underlying stocks, sector exposures, weighting methodologies, rebalancing processes, costs, and correlation to holdings. Investors should also consider whether they can remain invested through a prolonged period of underperformance.
Equity factor investing: Frequently asked questions
What are the major equity factors?
Common equity factors include value, growth, momentum, quality, size, volatility, liquidity, and dividend yield. Definitions vary across index providers and investment strategies.Is factor investing the same as sector investing?
No. Sector investing groups companies by their industries, while factor investing groups or weights companies according to shared characteristics. Companies in different sectors can therefore belong to the same factor group.Can equity factors predict which stocks will outperform?
No. Factors can help investors analyze historical market leadership and portfolio exposures, but they do not reliably identify the next market leader. Valuations, economic conditions, portfolio construction, and market pricing can change the result.Does combining factors guarantee diversification?
No. Different factor strategies may own overlapping securities or respond similarly to market conditions. Investors should examine holdings, sector exposure, construction methods, and correlations.What should investors review before choosing a factor strategy?
Investors should examine the factor definition, starting universe, sector neutrality, weighting approach, rebalancing frequency, costs, embedded exposures, and the potential for prolonged underperformance.Michael Rawson, Analyst, Equity Research and Strategy, contributed to this report.