Fed and Treasury Update: Higher-for-Longer Yields
Key takeaways
- The Federal Reserve remains on hold for now, but the risk of a rate hike is still present, based on recent inflation data, resilient economic growth, and more hawkish Fed commentary, in our view.
- We raised our expected range for the 10-year Treasury yield, reflecting a higher-for-longer rate outlook, lingering inflation uncertainty, and fiscal concerns. Slower growth would likely be needed for the yield to fall much lower.
- In our view, investors may want to keep duration below benchmark but not move entirely into cash; today's bond yields may still offer income opportunities, especially in selective short- or intermediate-term fixed income investments.
Treasury yields remain elevated after the Federal Reserve's hawkish pivot, and we think they may stay that way.
For now, we still expect the Fed to remain in "wait-and-see" mode, looking for a clearer reason to hike rather than moving quickly. But our conviction in a prolonged pause has faded as the odds of a rate hike later this year have increased. Inflation remains a concern, the economy is resilient, partly driven by artificial intelligence-related capital expenditures, and the labor market generally remains stable, albeit with some recent softness.
The risks of a rate hike have increased lately, but we don't believe we're there just yet. If the data changes—specifically if inflation comes in hotter-than-expected over the next few months—we'll likely change our view.
Against that backdrop, we believe there's more upside risk than downside risk with the 10-year Treasury yield. As such, we've raised our expected range for the 10-year Treasury yield to 4.25% to 4.75%, from the 4.0% to 4.5% range. The change reflects a higher-for-longer fed funds rate, lingering inflation uncertainty, and fiscal concerns. The resilient economy and a generally stable labor market should limit how much yields can fall in the near term.
We think investors may want to consider keeping average duration below benchmark, depending on their goals and overall portfolio needs—but that doesn't mean hiding out in cash. While we feel short-term yields are attractive, being too short comes with an opportunity cost.
The Fed holding—for now—with hike risk rising
The Fed held its benchmark interest rate steady in the 3.5% to 3.75% range at its July meeting, but three voting members dissented in favor of a hike. With inflation above the Fed's 2% target for more than five years and counting, a growing number of officials appear to believe additional tightening may be needed to bring inflation back to target.
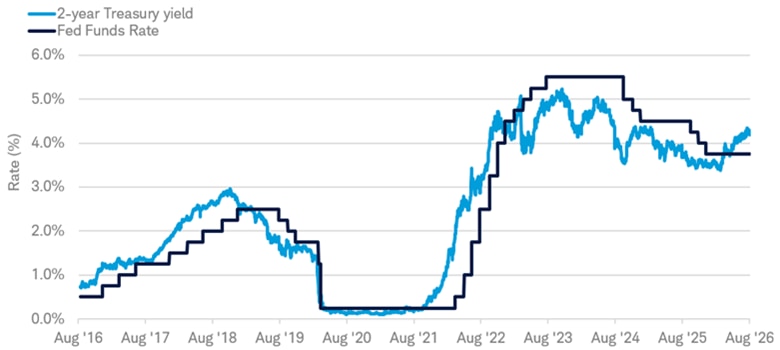
We are not in the "hike" camp just yet, but markets are now pricing in a rate hike by year-end, according to the fed funds futures market. More importantly, the 2-year Treasury yield has moved above the upper bound of the fed funds target range—a signal that's often preceded rate hikes in the past.
Fed funds rate vs. the 2-year Treasury yield
Source: Bloomberg.
US Generic Govt 2 YR (USGG2YR Index), Federal Funds Target Rate – Upper Bound (FDTR Index). Daily data from 8/6/2016 to 8/6/2026. Past performance is no guarantee of future results.
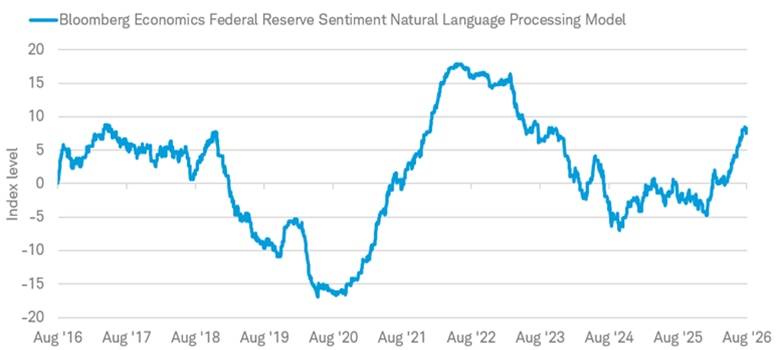
The Fed's hawkish pivot is well illustrated in the chart below, which tracks the data from the Bloomberg Economics Federal Reserve Sentiment Natural Language Processing Model. The model, also known as the Fedspeak index, measures the hawkish or dovish sentiment of Fed committee members based on public communications. A higher number means a more hawkish sentiment (meaning a bias towards more restriction), and a lower number means a more dovish sentiment (meaning a more accommodative bias).
After spending the second half of 2024 and most of 2025 below zero, or in dovish territory, the trend has reversed. But the level of perceived hawkishness is still well below the 2022 peak and close to 2016 through 2018 levels, which might suggest that only a minor adjustment to the fed funds rate may be necessary, rather than an aggressive rate hike cycle.
The Fedspeak index has turned more hawkish
Source: Bloomberg, using weekly data from 8/5/2016 through 8/5/2026.
Bloomberg Economics Federal Reserve Sentiment Natural Language Processing Model (BENLPFED Index). The Bloomberg Fedspeak index tracks the relative dovishness or hawkishness of communications from Fed members. The index scores more than 60,000 Bloomberg News headlines and is underpinned by an NLP model trained on thousands of annotations from the Bloomberg Economics team. For illustrative purposes only.
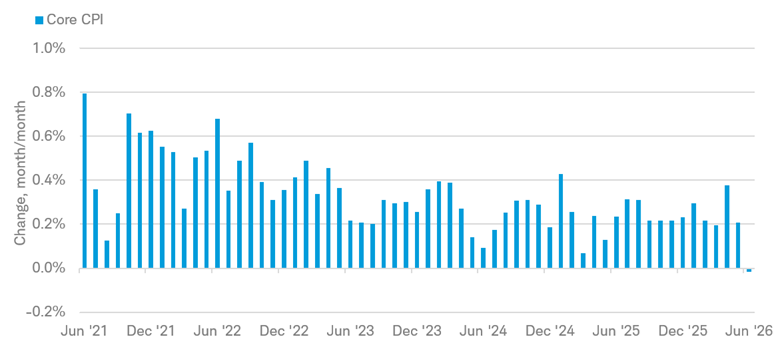
Inflation is the key variable for any expected move by the Fed. June's softer inflation data gave the Fed time to hold rates steady rather than hike. Most headlines indicated that core Consumer Price Index (CPI) was flat or unchanged in June, but that was on a rounded basis. The June decline was small—a drop of just 0.02%, but a decline nonetheless. That followed a string of readings at or above 0.2%, a threshold that, if resumed, could warrant a hike.
Although Fed Chair Kevin Warsh has generally avoided laying out what specific data he's watching and what conditions would justify a hike, others have been clearer. New York Fed President John Williams, vice chair of the Federal Open Market Committee, has said he wants to see monthly core inflation readings of 0.2% or less to feel confident that inflation is on a sustainable path toward the Fed's 2% goal. That bar may be difficult to clear given that several monthly readings over the past year have exceeded that threshold. A series of higher-than-expected inflation readings could increase the likelihood of a rate hike.
Core inflation moderated in June
Source: Bloomberg.
Source: Bloomberg. US CPI: Urban Consumers Core CPI MoM (CPI XCHG Index) percent change, month over month. Monthly data from 6/30/2021 to 6/30/2026.
While June's soft inflation prints were a step in the right direction, the recent trends in other inflation measures have made it harder to defend the case for staying on hold. Higher energy prices tied to renewed Middle East tensions may lift July's headline inflation readings.
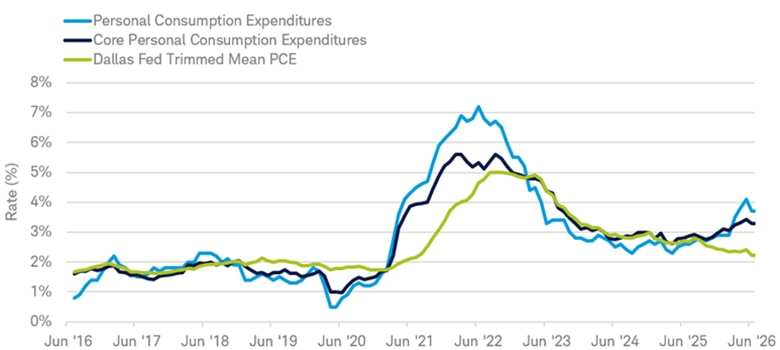
Fed officials typically look through supply shocks and one-off moves, focusing instead on core inflation, like the series shown above, which excludes volatile food and energy prices. But lately, even core inflation indicators have been moving in the wrong direction. The Dallas Fed Trimmed Mean PCE, a measure that Warsh has discussed lately, is showing more progress in getting closer to the Fed's 2% target, but it still remains above 2% despite its dip in June.
Most inflation measures are still above 2%
Source: Bloomberg.
PCE: US Personal Consumption Expenditures Chain-type Price Index YoY SA (PCE DEFY Index), Core PCE: US Personal Consumption Expenditure Core Price Index YoY SA (PCE CYOY Index), Dallas Fed Trimmed Mean PCE: Dallas Fed Trimmed Mean One Year PCE Inflation Annual Rate (MPCEPCEY Index), The Trimmed Mean PCE (Personal Consumption Expenditures), percent change, year over year. Monthly data from 6/30/2016 to 6/30/2026.
Note: Preferred inflation measure of Federal Reserve Chairman Kevin Warsh is the Dallas Fed Trimmed Mean One Year PCE Inflation Annual Rate. The Trimmed Mean PCE inflation rate is an alternative measure of core inflation in the price index for personal consumption expenditures (PCE). It is calculated by staff at the Dallas Fed, using data from the Bureau of Economic Analysis (BEA).
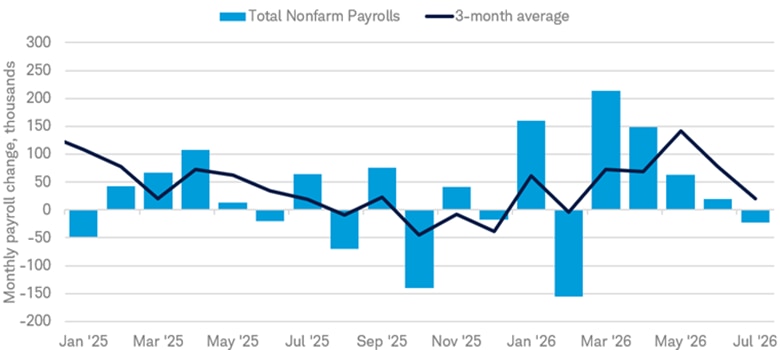
Inflation may be in the driver's seat, but the labor market still matters. When inflation is high and the labor market is weakening, the policy choice becomes more complicated. But when inflation is high and the labor market is stable, the Fed may worry less about the downside risks of a rate hike. July's jobs report came in a bit on the softer side, with nonfarm payrolls declining by 23,000 and the previous two months revised down by a combined 103,000. Along with the soft June inflation print, this allows the Fed to remain patient for now and see how the data evolves over the next few months.
Total nonfarm payrolls
Source: Bloomberg.
U.S. Employees on Nonfarm Payrolls, Total, MoM, Net Change SA (NFP TCH Index). Monthly data from 1/31/2025 to 7/31/2026.
Raising our 10-year Treasury yield range
Given the Fed's hawkish shift—and the likelihood that short-term rates remain elevated whether the Fed holds or hikes—we're raising our near-term outlook for the expected range of the 10-year Treasury yield to the 4.25% to 4.75% range, up from our previous 4.0% to 4.5% range.
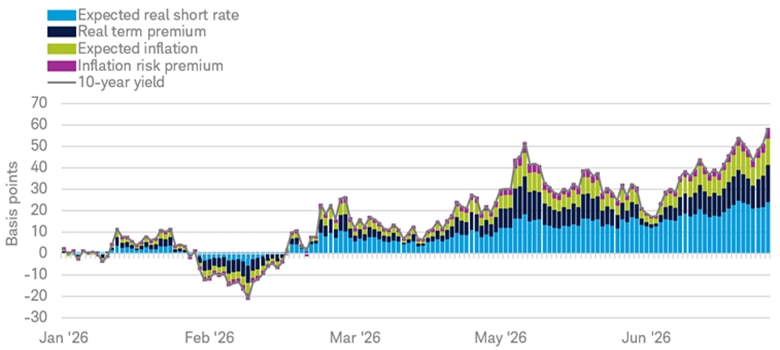
Central to that view are higher short-term rates, which have also been the main force behind the recent rise in long-term yields. Despite persistent inflation concerns, the latest move in the 10-year Treasury yield toward 4.75% has been driven less by rising inflation expectations and more by expectations for higher short-term interest rates.
Drivers of the year-to-date change in the 10-year Treasury yield
Source: Macrobond, Federal Reserve.
Federal Reserve D'Amico, Kim & Wei (DKW) No-Arbitrage Term Structure Model Expected Real Short Rate (USRATE1929 Index), Federal Reserve D'Amico, Kim & Wei (DKW) No-Arbitrage Term Structure Model Real Term Premium (USRATE1941 Index), Federal Reserve D'Amico, Kim & Wei (DKW) No-Arbitrage Term Structure Model Expected Inflation (USRATE1940 Index), Federal Reserve D'Amico, Kim & Wei (DKW) No-Arbitrage Term Structure Model Inflation Risk Premium (USRATE1942 Index), and Federal Reserve D'Amico, Kim & Wei (DKW) No-Arbitrage Term Structure Model 10-Year Nominal Yield (USRATE1945 Index). Data shown in basis points. Daily data from 1/2/2026, through 7/31/2026.
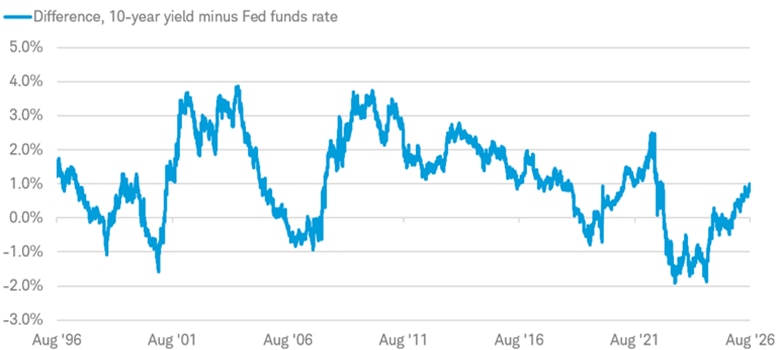
The difference between the 10-year Treasury yield and the fed funds rate is another driver of our view for higher long-term yields. That gap has increased lately, with the 10-year Treasury yield at a 0.9% advantage over the fed funds rate on August 6, closing in on the 30-year average of 1.1%. That means that there's room for some upside if the Fed holds rates steady, while any potential rate hike (or hikes) makes the case even stronger for long-term yields to stay elevated.
The gap between the 10-year Treasury yield and the fed funds rate has risen lately
Source: Bloomberg.
US Generic Govt 10 YR (USGG10YR Index), Federal Funds Target Rate – Upper Bound (FDTR Index). Daily data from 8/6/1996 to 8/6/2026.
Past performance is no guarantee of future results.
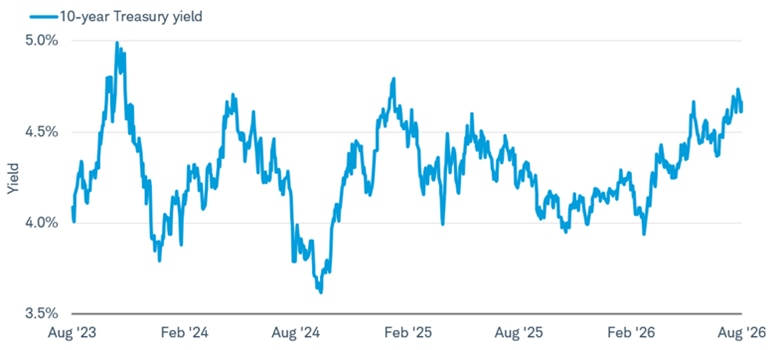
Although yields are elevated, and with more risks to the upside than the downside, we don't believe now is the time to be aggressively adding longer-maturity investments to a bond portfolio, but investors may consider them in moderation, depending on risk tolerance and investing horizon. Keep in mind that higher yields also mean a risk of price declines. Importantly, we don't expect investors to necessarily miss out on the yields that bonds currently offer. The 10-year Treasury yield has generally held between 4% and 5% since the middle of 2023, with a few exceptions. In our view, yields may remain elevated while the Fed maintains a hawkish bias and the economy remains resilient.
The 10-year Treasury yield has generally held in a tight range for the last few years
Source: Bloomberg.
Generic 10-year Govt bond yield (USGG10YR Index). Data from 8/6/2023 to 8/6/2026.
Past performance is no guarantee of future results.
With more upside risks than downside risk to long-term yields, we favor a below-benchmark duration stance. Duration is a measure of interest rate sensitivity and it's often related to a bond's maturity. The Bloomberg US Aggregate Index is often considered the benchmark index for investment-grade bond investments in the U.S., and it has an average duration of 5.9 years. As such, a "below benchmark" duration stance would mean an average duration of less than 5.9 years.
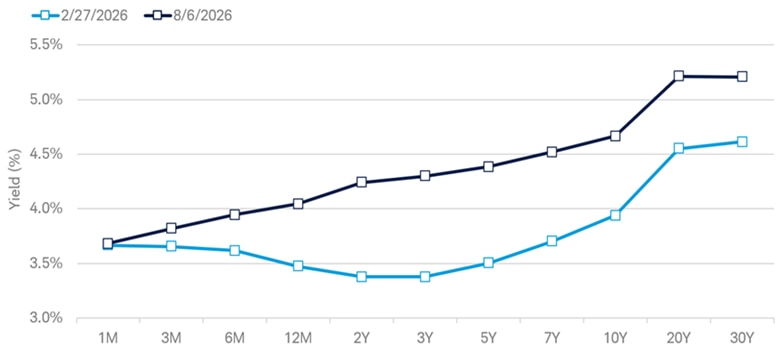
Still, yields are high enough that investors do not need to abandon intermediate- or long-term bonds entirely and focus only on ultra-short or cash-like investments. There's an opportunity cost to that approach: The 2-year Treasury yield is currently above yields on many shorter-term Treasury bills, suggesting investors may be able to earn more income by extending modestly beyond cash-like investments. Market expectations currently suggest the fed funds rate could rise to the 4% area by the middle of next year, while the 2-year Treasury yield offers a yield near 4.2%. We suggest investors consider higher-yielding short-term investments now rather than waiting for a Fed rate hike that may or may not come.
The better approach, in our view, is to stay selective: keep duration somewhat short, but avoid moving so far into cash that portfolios miss out on potential income and reinvestment opportunities.
The yield curve remains upward sloping
Source: Bloomberg.
U.S. Treasury Actives Curve (GC C15). Data as of 2/27/2026 and 8/6/2026. Bars show the change in yield for the various tenors of the yield curve, in basis points.
Past performance is no guarantee of future results.
What to consider now
Don't let concerns about whether the Fed hikes rates this year be a key driver of a bond investing decision today. We believe bond yields, while off their recent peaks, still appear attractive relative to the last 16 years. It may be tempting to wait for the Fed to hike rates to consider investing in bonds, but timing the market—any market—is not something we suggest any investor tries to do.
We see more potential upside than downside risks with long-term Treasury yields, therefore suggest a below-benchmark average duration. We don't believe now is the time to add too much duration to a portfolio given the potential upside risks to yields, but that doesn't mean investors should hide out in cash.
We have a more favorable view on investment grade corporate bonds, high-yield corporate bonds, and preferred securities, while recognizing that these investments carry risks, including credit, liquidity, price volatility, and—for lower-rated securities—greater default risk. We acknowledge that spreads remain relatively low for many corporate bond investments, and that a resilient economy may keep spreads low. We encourage investors to focus on the yields that they offer, rather than potential price appreciation, and to be prepared for occasional volatility.