Getting Started With thinkorswim® web

Schwab's thinkorswim® desktop platform is comprehensive and customizable but also complex. For a more streamlined experience, the web version offers access, monitoring, and the most essential trading tools from any device.
To get started, log in to thinkorswim web.
Step 1. View your positions
Source: thinkorswim® web platform. Any investments reflected are for illustrative purposes only. Not intended to be, nor should they be construed as, a recommendation to buy, sell, or continue to hold any investment. Screenshots are for illustrative purposes only, may be historical in nature, and should not be used as a basis for any investment decision.
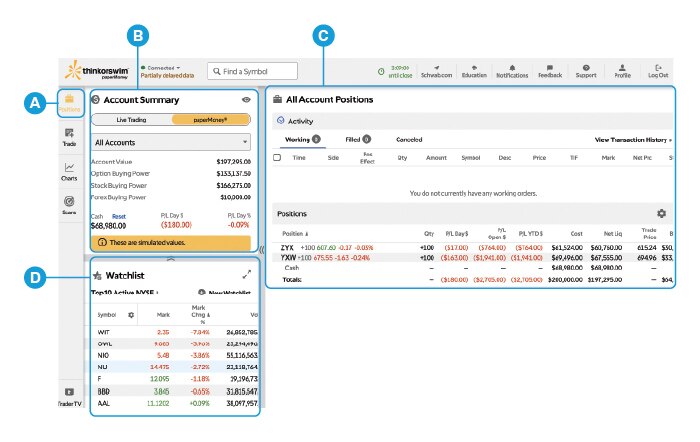
The default view after login is the 🅐 Positions panel. Here you'll see:
- Your 🅑 Account Summary, where you can toggle between Live Trading and paperMoney®, the thinkorswim virtual trading platform. From there, choose All Accounts or a specific account to check your account value, buying power, total cash, and daily profits or losses.
- Your account 🅒 Activity and Positions.
- Your 🅓 Watchlist, where you can select an existing or custom watchlist from the dropdown or create a New Watchlist.
Step 2. Research your stocks
Source: thinkorswim® web platform. Any investments reflected are for illustrative purposes only. Not intended to be, nor should they be construed as, a recommendation to buy, sell, or continue to hold any investment. Screenshots are for illustrative purposes only, may be historical in nature, and should not be used as a basis for any investment decision.
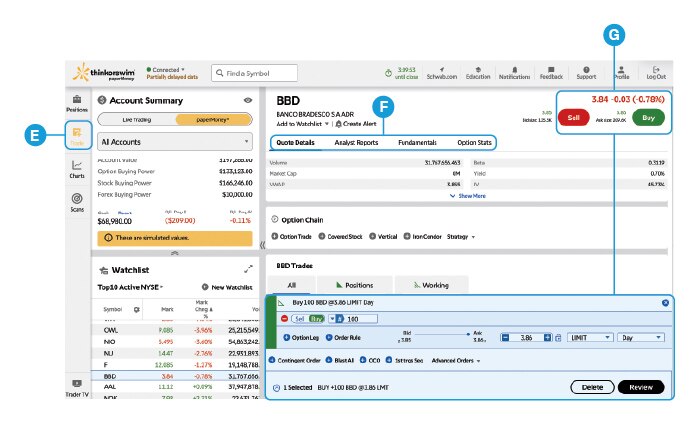
To explore a specific stock in your Watchlist or Positions list, click its symbol to reveal the 🅔 Trade panel, where you can view 🅕 stock information, including:
- Quote Details, such as earnings per share, market capitalization, trading volume, yield, and more.
- Analyst Reports from a variety of sources, including Argus, CFRA, Morningstar, Schwab Equity Ratings, and more.
- Fundamentals, including metrics such as cash flow per share, financial leverage, gross profit margin, return on equity, and more.
- Option Stats, which breaks down volume of puts versus calls traded.
Step 3. Placing a trade
To place a trade, click the 🅖 Buy or Sell button, which will reveal the trade table at the bottom of the screen. From there you can:
- Adjust the order quantity.
- Change the order type and set the order expiration.
- Set other criteria, such as contingencies, conditions, and advanced orders.
Step 4. Using technical analysis
Source: thinkorswim® web platform. Any investments reflected are for illustrative purposes only. Not intended to be, nor should they be construed as, a recommendation to buy, sell, or continue to hold any investment. Screenshots are for illustrative purposes only, may be historical in nature, and should not be used as a basis for any investment decision.
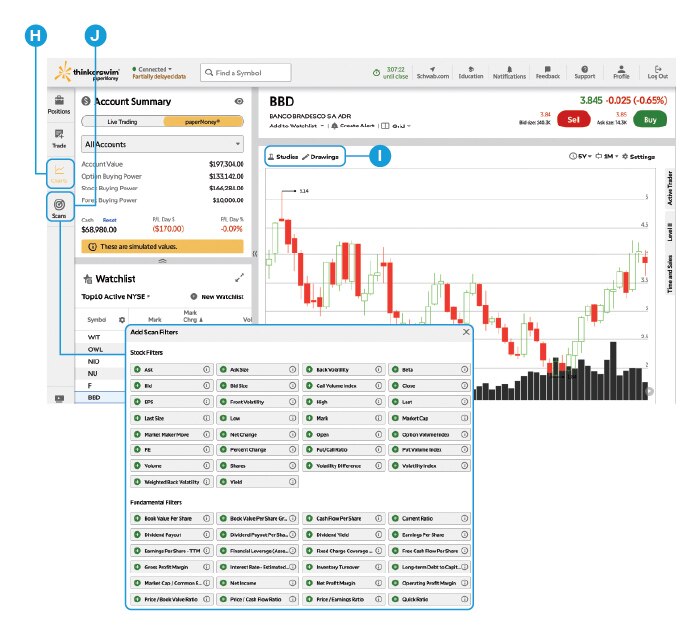
For those who use technical analysis to inform their trades, the 🅗 Charts panel offers simplified charting tools with the 🅘 Studies and Drawings features front and center.
And to further research stocks using a variety of financial, valuation, and technical criteria, the 🅙 Scans panel offers dozens of Scan Filters to narrow your list.
Need assistance or want more tips on navigating thinkorswim?
Schedule a call with a Trading Solutions specialist.
Discover more from Onward

Keep reading the latest issue online or view the print edition.