How to Pick Stocks: Fundamentals vs. Technicals

Fundamental and technical analysis are two common ways to sort and pick stocks. How and when to use them can be a matter of personal style, but each has its strengths.
Fundamental analysis attempts to identify stocks offering strong growth potential at a good price by examining the underlying company's business, as well as conditions within its industry or in the broader economy. Investors have traditionally used fundamental analysis for longer-term trades, relying on metrics like earnings per share (EPS), price-to-earnings (P/E) ratio, P/E growth, and dividend yield.
Technical analysis, on the other hand, bypasses the underlying company's fundamentals and instead looks for statistical patterns on stock charts that might foretell future price and volume moves. The idea here is that stock prices already reflect all the publicly available information about a particular company, so there's nothing to be gained from poring over a balance sheet, income statement, or other financial information. Given the focus on price and volume moves, traders have traditionally used technical analysis for shorter-term trades.
But does it have to be an either/or proposition?
Which type of analysis is right for you?
Both fundamental and technical analysis can reveal potentially valuable information, and focusing on just one style could cause you to miss important clues about a stock’s prospects. And because the intended duration of an investment or trade may change, using both forms of analysis is an approach you might consider.
Why not deploy them so their strengths complement each other? For example, a trader might use fundamental factors to select the stock candidate and technical factors to identify a specific entry or exit price.
Growth investor's strategy
Growth investors focus on the future prospects of a particular company. Corporations are generally built to grow and turn a profit—and eventually return some of that profit to shareholders. Very few new companies are immediately profitable. But if a company reports strong revenue growth initially—even if it fails to turn a profit in its early days—growth investors may still decide it's a good prospect for the future. When investors decide a young company has an innovative product or compelling competitive advantage, they may start to accumulate stock, which tends to move the price higher. The more investors who join the party, the higher the company’s stock price is likely to rise. Such investors typically focus on metrics like a company’s historical and projected revenue growth rates when buying shares of relatively new companies.
Value investor's strategy
Value investors focus on whether the current stock price makes sense given the health of a particular company and typically seek companies that appear to be priced below what their revenues, EPS, or other fundamental metrics suggest. Such investors often focus on industry-leading companies, which are generally past their peak revenue growth years, because these companies often pay steady dividends. Value stocks tend to have relatively lower P/E ratios and pay above-average dividends, but they can trade at a price that is very low or below their book value (total tangible assets minus total liabilities). Sometimes value investing is described as investing in great companies at a good price, not simply buying cheap stocks.
Screening for growth or value
Schwab clients can use a stock screening tool on Schwab.com under Research to help narrow a collection of stocks to a manageable list of quality growth or value candidates.
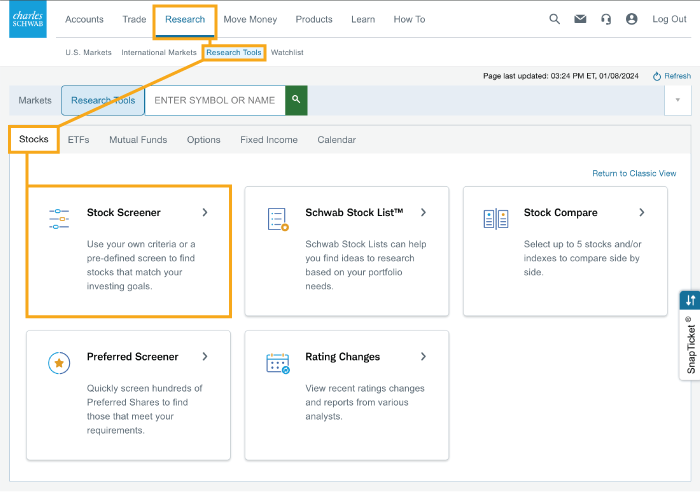
Source: Schwab.com
When screening for fundamental factors, consider focusing on stocks rated A or B by Schwab Equity Ratings® because these are considered "buy" candidates relative to the other rated securities (C-F). In the example below, this step alone narrows the list of possible stocks from 2,800 candidates to 814 candidates.
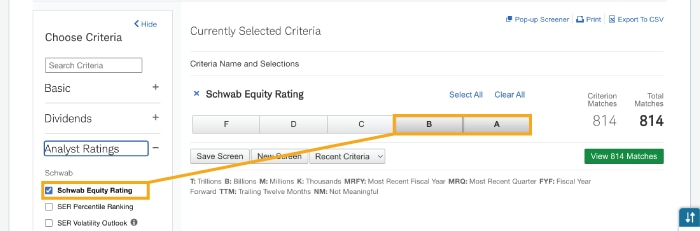
Source: Schwab.com
Growth screening
Because Schwab Equity Ratings already takes many fundamental factors into account, investors searching for growth stocks could seek out stocks that have delivered strong revenue growth in the past and that appear set to deliver both strong revenue and profit growth in the future. In the example below, which screens for at least 25% revenue growth over the last three years, current year earnings growth, and current year EPS growth, selecting these three additional criteria narrows the list of 814 candidates to just five.
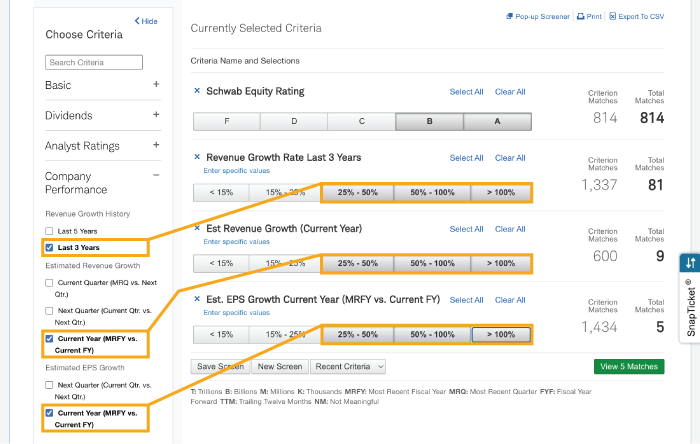
Source: Schwab.com
Value screening
You can use several other metrics when searching for value stocks, though a simple approach would be to consider those with:
- An above-average dividend yield (but not too high)
- Low P/E ratio
- A price that is less than the company’s book value
In the example below, selecting these three additional criteria shrinks the list of 814 down to 25.
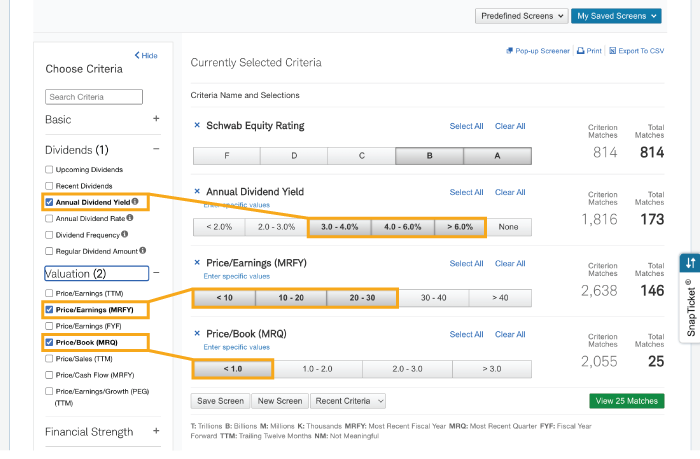
Source: Schwab.com
As you search, be wary of extremely high dividend-yielding stocks because they might be too good to be true. On a similar note, keep in mind that a cheap share price doesn’t necessarily suggest a stock is undervalued. A low stock price could be the result of a company’s outdated products, bad management, expired patents, pending lawsuits, etc.
Once you have a more manageable list of five or six candidates, it’s time to apply some technical screeners.
Selecting stocks using technical signals
Stock selection using technical analysis generally involves three steps: stock screening, chart scanning, and setting up the trade. With stock screening, your goal might be to arrive at a list of 20 or 25 candidates using a set of technical criteria. You could then try to narrow that list down to three or four candidates by scanning the charts for possible entries, or points where it could make sense to buy. Finally, you'll perform a more detailed chart analysis and choose the one you may consider trading.
Screening stocks
To set up a screen, consider the following items:
- Price and market capitalization. This can be a good place to start because it allows you to eliminate a lot of stocks right away. For example, if you’re not interested in stocks priced over $100, you could exclude them in the search.
- Sectors and industries. Many traders compartmentalize the stock market into broad sectors (technology, energy, financials, etc.) or, going further, break it into industry groups, like software, semiconductors, and computer hardware within the technology sector. Look for strong sectors and industry groups if you want to go long—that is, buy a stock with the expectation that its price will rise—and weak ones if you want to go short—which means borrowing and selling a stock whose price you think is going to fall, and then buying it back later at a lower price should it actually fall, all with the expectation that you’ll pocket the difference. Because short selling involves potentially unlimited risk if the underlying stock moves higher, it's considered an advanced strategy and also requires a margin account.
- Momentum. Technical traders usually want to identify strong, uptrending stocks for potential buys and weak downtrending stocks for potential shorts. One way to find them is to use moving averages, which are indicators that smooth out day-to-day price movements to show a stock’s general direction over time to identify the primary price trend. They can also act as support and resistance levels. Support is an area on the chart where downward trends seem to find a floor as buying pressure overcomes selling pressure. Resistance is often a price area where the upward trends start to fizzle as selling pressure overcomes buying pressure.
A simple moving average is calculated by averaging a stock’s closing prices over a defined period. Many traders use 20 days as a starting point, but you can use different periods, such as 50 or 200 days, according to your trading style.
A momentum trader going long might ask, is a stock trading above its 20-day moving average? Has its 20-day moving average broken above its 50-day moving average? A trader looking to short a stock might search for one trading below its 20-day moving average and has a 20-day moving average below its 50-day moving average. You might narrow the list further by looking for stocks that trade at least 200,000 shares per day.
Scanning charts
After compiling a list of candidates, it’s time to look for those with good entry points. Two common entry strategies are either to look for breakouts in the direction of the trend—for example, stocks experiencing a sharp upward movement in price—or to look for pullbacks, which are short-term moves in the opposite direction of the longer-term trend to a historical support level.
For breakouts on longs, an entry point could be the first or second new high after the stock has traded sideways, or consolidated, for a period of time. For breakouts (or perhaps more aptly called a breakdown) on shorts, an entry point could be the first or second new low after a period of sideways consolidation. With the pullback strategy, you may want to see the stock correct for a few days in the direction opposite the trend. You might then consider buying into that short-term weakness on the longs or selling into that short-term strength on the shorts.
Setting up the trade
We’ll assume for the sake of discussion that you prefer pullback entries and have narrowed your choices down to two buy candidates, stock A and stock B. To choose between them, it could make sense to bring a few indicators to bear: price patterns, volume, moving averages, and an indicator called the stochastic oscillator.
Because we’re looking for pullbacks, our first task is to confirm a price change is likely to be a temporary move and not a full-on reversal. Chances of a reversal are lower if the stock has pulled back to a support level, such as a moving average or an old low. However, this isn't a guarantee. We also want to know if a pullback is ending. For example, if a stock can push past the previous day’s high, it could mean the uptrend is resuming.
On to our charts. We can see that both stocks A and B have pulled back and held their 20-day moving averages (the yellow lines). So far, so good.
Stock A
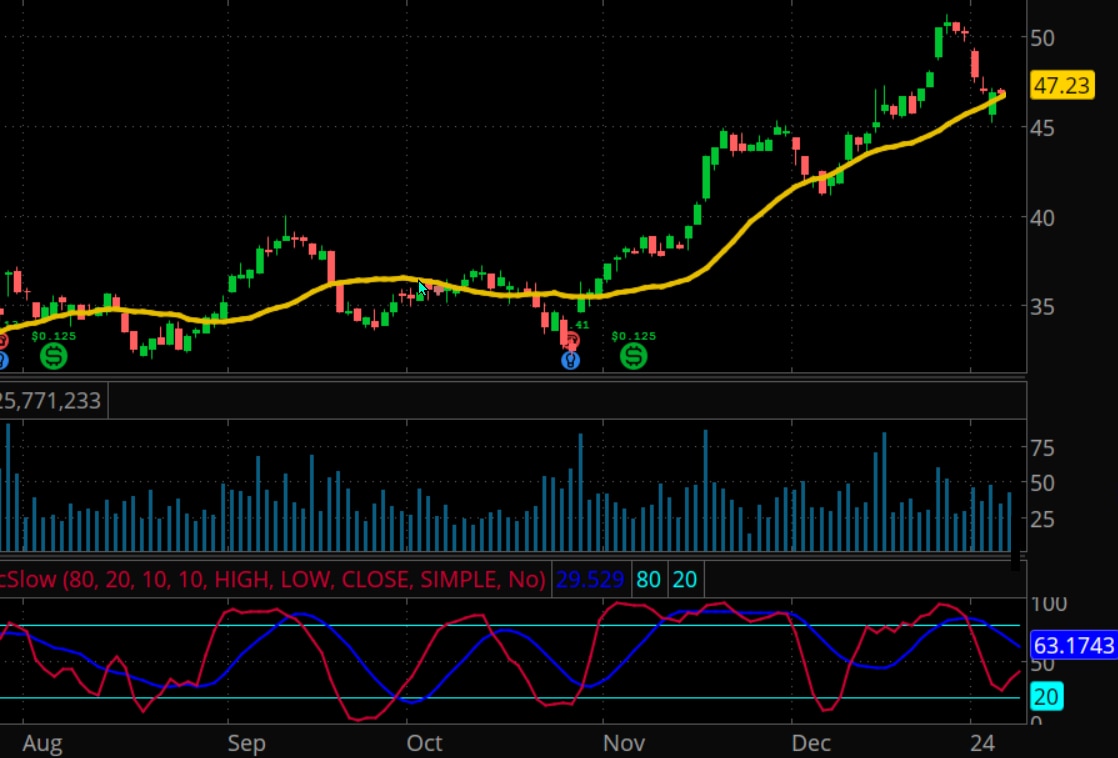
Source: thinkorswim® platform
Stock B
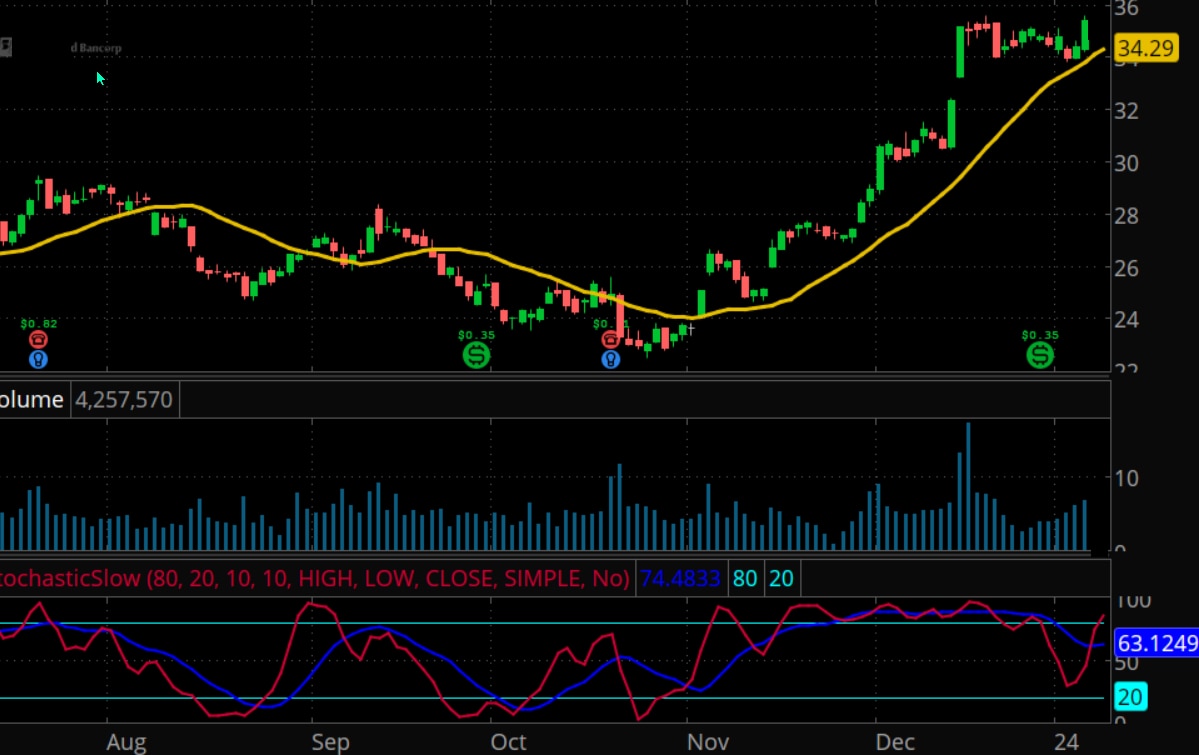
Source: thinkorswim platform
Here's where we bring in the stochastic oscillator. Basically, this is a momentum indicator that compares a stock's current price to its highs and lows over a given period. Values can range from 0 to 100, with a reading over 80 indicating that the stock may be "overbought" and possibly overextended on the upside. Readings under 20 indicate that the stock is "oversold" and possibly overextended on the downside. On a chart, the stochastic oscillator consists of two lines, the %K (fast line, in red in the chart above) and %D (slow line, in blue). The former is the value for the current trading session. The latter is a three-day moving average of the former.
When a stock is trading in a particular range, and the oscillator's values move into overbought or oversold areas, look for a price reversal. However, be warned that if a stock is strongly trending in a particular direction over a long period, the values could stay in overbought or oversold territory for an extended period. In either case, it can make sense to compare the %K and %D lines. If the lines are converging or diverging, it could signal a shift in momentum is in the works.
Let's apply this to our hypothetical trade by looking at the last trading day for each stock. We can see that stock A was unable to trade above the previous day's high, either on an intraday or closing basis. Also, it traded in a narrow range and closed about where it opened, all signs that buyers lacked conviction.
Looking closer, the %D line indicates stock A isn't oversold, which is good. However, the two lines haven't crossed—as you can see, %K is still below %D. If %K had crossed %D, that would show a little more upside strength.
On a positive note, volume was relatively light: Heavy volume can be a danger sign when the stock moves in the opposite direction of the trend.
The last trading day on stock B tells a different story. The stock not only traded above the previous day's high during the course of the trading day, but it also managed to close above it. Also, it had a wide-range day with a close near the top. These are all signs the buyers may have regained control of the primary trend and the pullback is over, especially because this price action occurred on the back of higher-than-average volume. Also, the stochastic oscillator shows that neither %K nor %D are oversold, indicating strength. In addition, %K has crossed %D, which is another bullish sign. In sum: Stock B looks like the stronger candidate.
Simplify your stock selection
Stock selection doesn't have to be difficult, but you do need to be flexible. Look for markets that are moving but also be willing not to trade. Consider going short as well as long. Finally, and perhaps most importantly, you need to be disciplined. Don't let the inevitable bad trades turn into a disaster. Keep your losses small and live to trade another day.