How to Trade Simple Moving Averages

Technical trading is a lot like surfing—learning to read the "waves" can help traders determine their strength and direction. This is especially true of moving averages.
As the running average of a stock's closing price over time, moving averages tend to smooth out the noise of daily trading activity and help traders identify when trends are established or broken—which can be valuable entry and exit signals.
Here's how moving averages can help inform trades.
Keep it simple
The most commonly used moving average is a so-called simple moving average (SMA), which is the average closing price of a given security over a specific number of days. For example, traders can find a stock's 20-day SMA by adding its prices over 20 days, then dividing that number by 20.
SMAs can be used as potential indicators of:
- Support, or the level at which a stock's price has difficulty breaking below due to buyers wishing to take advantage of the lower value. When an SMA acts as a support indicator, it runs below the current stock price, acting as a bottom—when the stock price tests the support, it typically rebounds.
- Resistance, or the level at which a stock's price has difficulty breaking above because of the number of investors willing to sell at that price. When an SMA acts as a resistance indicator, it runs above the current stock price, acting as a top; when the stock price tests the resistance, it typically falls back.
Deciding which SMA time frame to use often comes down to the trading time horizon. If a trader rarely holds a stock for more than 10 trading days, for example, the 20- or even 10-day SMA may provide good insights into how a stock's price has been moving recently. If someone is more of a "position" trader—that is, they're willing to hold a stock for up to a year—the 200-day SMA is going to give a better sense of a stock's long-term price pattern.
That said, some stocks break through their moving averages more often than others, which can make it difficult to identify support or resistance. If a stock's price regularly dips below its 50-day average, for example, any breaks above or below the line might be seen as less noteworthy. In such cases, adding a slightly longer SMA for comparison—such as the 200-day SMA—might make it easier to assess whether the stock has truly broken through its support or resistance.
Another factor to watch is how short- and long-term SMAs interact. When they cross over, it can indicate one of two things: The price's direction is beginning to shift, or the recent break from a longer-term trend is likely to continue.
Crossing paths
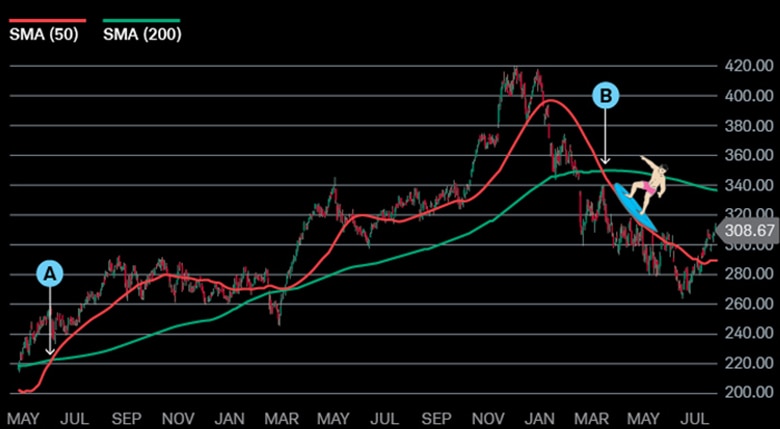
When short- and long-term moving averages intersect, it could indicate a shift in price action.
Consider the 50- and 200-day SMAs for stock ZYX:
A: The 50-day SMA breaks above the 200-day SMA at the start of the period, prefacing a long, upward trend.
B: It isn't until the 50-day SMA breaks back below the 200-day SMA almost two years later that the stock begins a new sustained, downward trend. Traders who sold after the price dipped during the first year—when the 50-day came close to the 200-day but didn't break below it—would have lost out when the upward trend resumed.

Source: Schwab.com.
For illustrative purposes only.
Time your moves
Those who are new to trading averages should take a more cautious approach until they develop an eye for identifying trends. Until then, consider the following tips:
- Start long: Longer moving averages tend to smooth out spikes in volatility. That can help traders ignore brief bouts of rising or falling prices that quickly peter out. There will be fewer opportunities to trade and potentially profit, but buying and holding for longer periods has its advantages, including reduced risk of getting wiped out on a single trade. As traders grow more confident, they can begin to shorten their trading periods and rely more on shorter-term averages.
- Add and subtract: Trading moving averages is not a perfect science, and even seemingly obvious signals sometimes don't pan out. When traders are just starting out, it's common for them to make piecemeal trades by looking for opportunities to selectively add to or subtract from positions as until they get more comfortable reading SMAs.
Don't rush it
Moving averages can be tricky to trade. They sometimes give competing signals that leave traders unsure of whether to act. So, if ever in doubt, sit it out. The good news is the waves just keep on coming.