How to Use Volume-Weighted Indicators in Trading

Just like in sports or politics, momentum is an important and influential force in the markets. Volume drives momentum, which is why some chartists keep an eye on volume regardless of what other indicators they're using. Volume-based indicators like the volume-weighted average price (VWAP) illustrate how many orders are driving price changes and can provide clues about the overall market mood. By simultaneously tracking price action and volume, VWAP serves as both a benchmark and a guidepost, showing what's happening in a volatile market.
What is volume-weighted average price (VWAP)?
VWAP is the average price a security traded at throughout the day, adjusted for volume. In other words, price changes accompanied by higher volume carry more weight than price changes that occur amid low volume. Institutional traders may track VWAP to determine the average prices of large orders, while retail traders look to it to monitor intraday price movement and consider entry and exit points.
By monitoring VWAP, traders might also get an idea of a stock's liquidity as well as the price buyers and sellers agree is fair at a specific time. If the stock is trading below its VWAP, it suggests sellers are dominating and the current price could be a good deal. If buyers are in control, the stock is likely to trade above its VWAP.
How is VWAP calculated?
VWAP is calculated using the cumulative total of the price of each trade, multiplied by the volume of that trade. This figure is then divided by total volume traded that day. In order for chart watchers to see how VWAP changes along with the stock price, the indicator can be overlaid on a price chart, similar to a moving average.
On the thinkorswim® platform, traders can view VWAP without using the formula. From the Charts tab, add a symbol and open an intraday chart. Select Studies, and from the drop-down menu, select Add Study > Market Strength Studies > VWAP.

Source: thinkorswim platform
For illustrative purposes only. Screenshots are historical in nature.
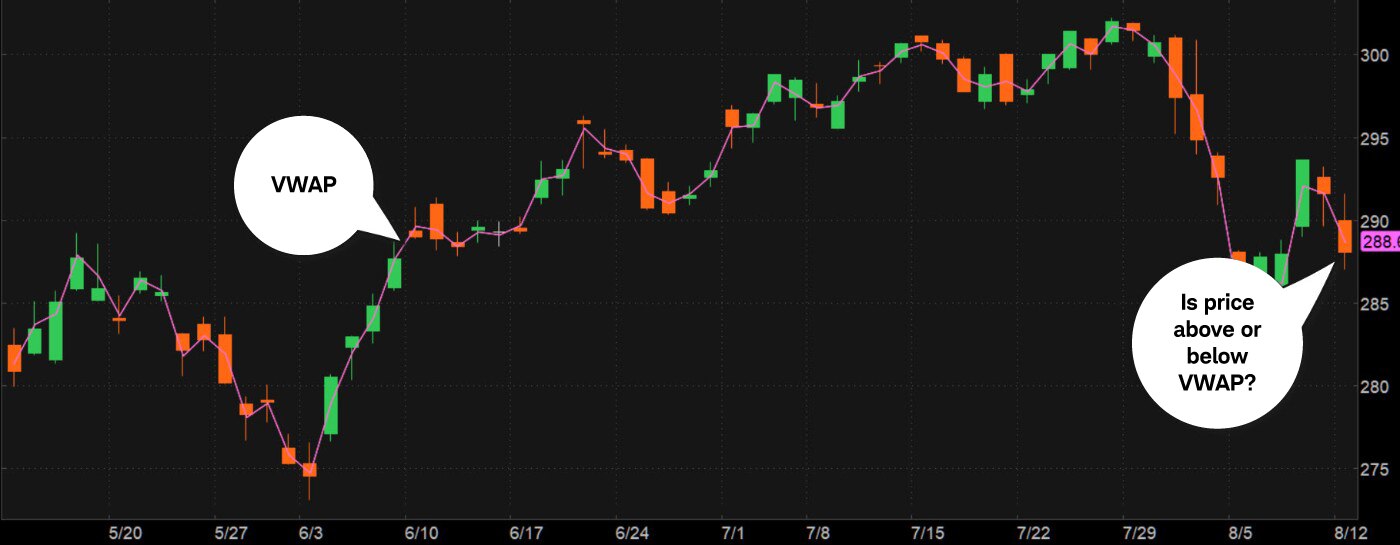
On the above chart, the VWAP is the purple line that intersects the price. Because VWAP is an average, it lags the current price level. Typically, when VWAP slopes up, it indicates prices might be trending up, and when it slopes down, prices might be following suit. And, like a moving average, a trader can use VWAP as a reference point to help make entry and exit decisions.
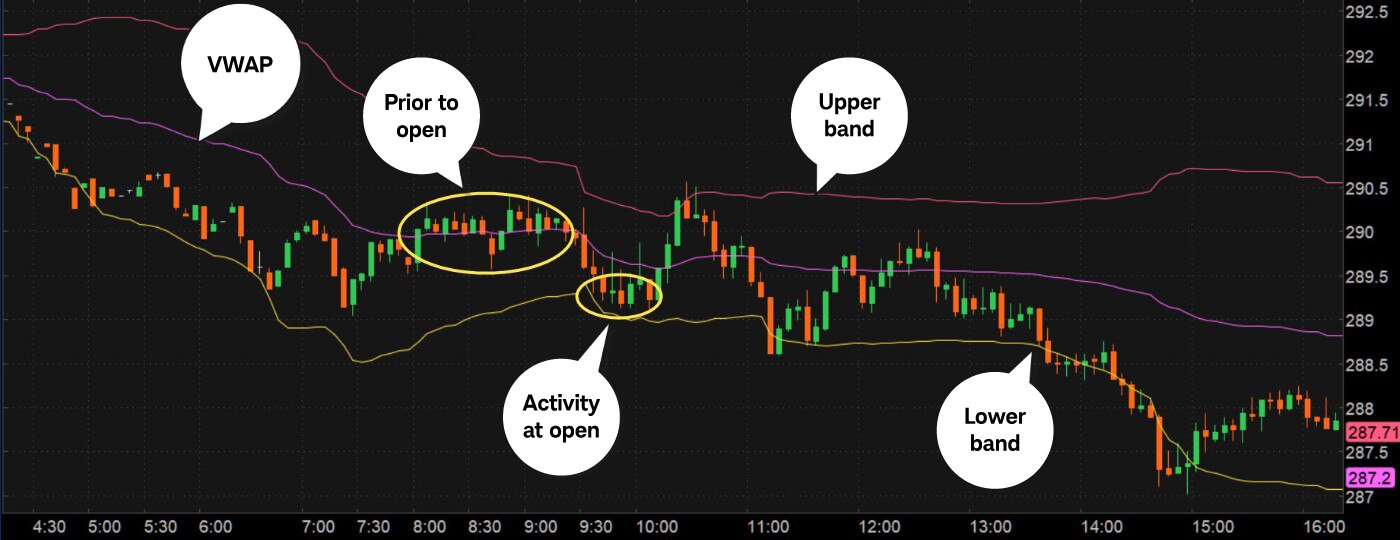
On thinkorswim, the VWAP study includes two additional bands—one above and one below the VWAP. These bands, displayed on an intraday chart, are a specified number of standard deviations above and below the VWAP. The upper band might be considered an overbought level, and the lower band might be considered an oversold level.
One trait of VWAP is that it's calculated from the time the market opens to when it closes. A trader can potentially see price and volume action unfold in real time at a specific point in the trading day, providing guidance short-term traders might use when executing their trades.
A day in the life of VWAP-based trading
One way to analyze VWAP is to observe price action as it approaches a significant line on the chart. In the above image, it's possible to see a price consolidation prior to the open during which VWAP is relatively flat or has low momentum. When the markets opened, momentum increased and, in this case, price moved below VWAP and approached the lower band but didn't quite reach it.
The stock price then moved back up, broke above VWAP, and reached the upper band, which acted as resistance. The stock's price quickly retraced back toward VWAP, where it remained for a couple of bars before breaking below it to approach the lower band.
This time, when the price bar reached the lower band, it dipped below it and started inching back up. After a few bars, it tested the lower band again. It then moved back up toward VWAP and remained somewhat steady, indicating momentum could potentially be slowing down.
During afternoon trading, prices started moving back toward the lower band, with the lower band acting as a support level and VWAP as resistance.
About two hours before the close, momentum started picking up with prices gravitating toward —and even breaching—the lower band. During the last hour of trading, prices began moving back above the lower band. As the markets closed, the slight decline in VWAP suggested a potential downward trend and lower volume. Momentum usually slows to a crawl after the market closes.

Source: thinkorswim platform
For illustrative purposes only. Screenshots are historical in nature.
The VWAP calculation for the day comes to an end when trading stops. At the next open, a new VWAP calculation begins, unrelated to what happened the previous day.