Identifying Trend Reversals With RSI

Over the course of a stock's trading history, there are times when investors are either too bearish or too bullish, at least when it comes to the fundamentals. However, knowing when these attitudes might lead to a trend reversal isn't always obvious.
Enter the relative strength index (RSI), which measures momentum, or the degree and speed of price movements. This technical analysis tool can help identify when a stock is potentially overbought or oversold.
Here's how the RSI works, how it can help traders identify potential trade signals or buy and sell opportunities, and what to consider before adding RSI to a trader's toolbox.
The basics
The RSI tracks the strength of a security's price against its own history—its average gains divided by its average losses—over a specific period of time. A stock's RSI typically looks at the most recent 14 trading days, though traders can shorten the time frame to generate more trading signals or extend it to produce fewer but possibly more reliable signals.
When it comes to a security's RSI reading—on a scale from 1 to 100—there are two numbers to watch:
- When a stock's RSI moves above 70, it's generally considered overbought—and traders may see an exit opportunity when it crosses back below 70.
- When a stock's RSI moves below 30, it's generally considered oversold, providing traders an entry opportunity when it crosses back above 30.
Strength signals
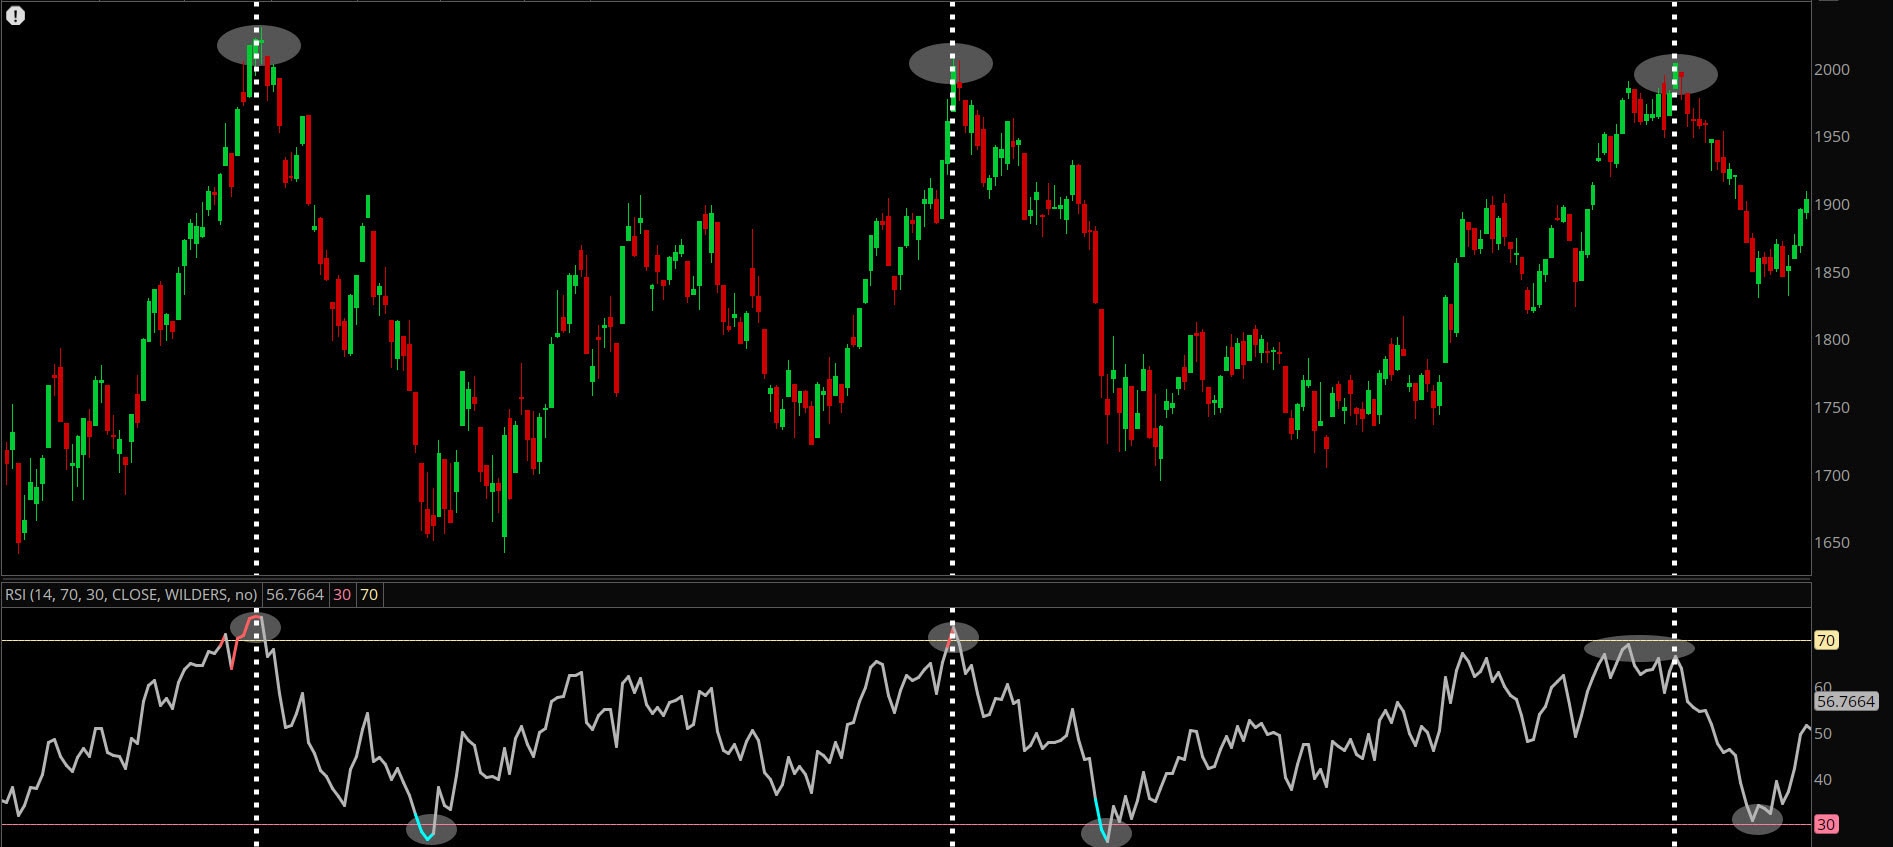
Source: thinkorswim® platform
The example is hypothetical and provided for illustrative purposes only.
Look for divergences
When a stock's RSI diverges from its price, a trend reversal may be afoot.
For example, a trader might expect an uptrending stock to exhibit higher highs in its RSI readings as investor enthusiasm builds. However, when a stock registers a higher high in price but a correspondingly lower high in its RSI, this is known as a negative divergence, signaling slowing momentum, and it could be signaling an impending reversal.
Conversely, when a stock registers a lower low in price but a higher low in the RSI, this represents a positive divergence and could be signaling that the downtrend may be about to reverse.
Lower highs
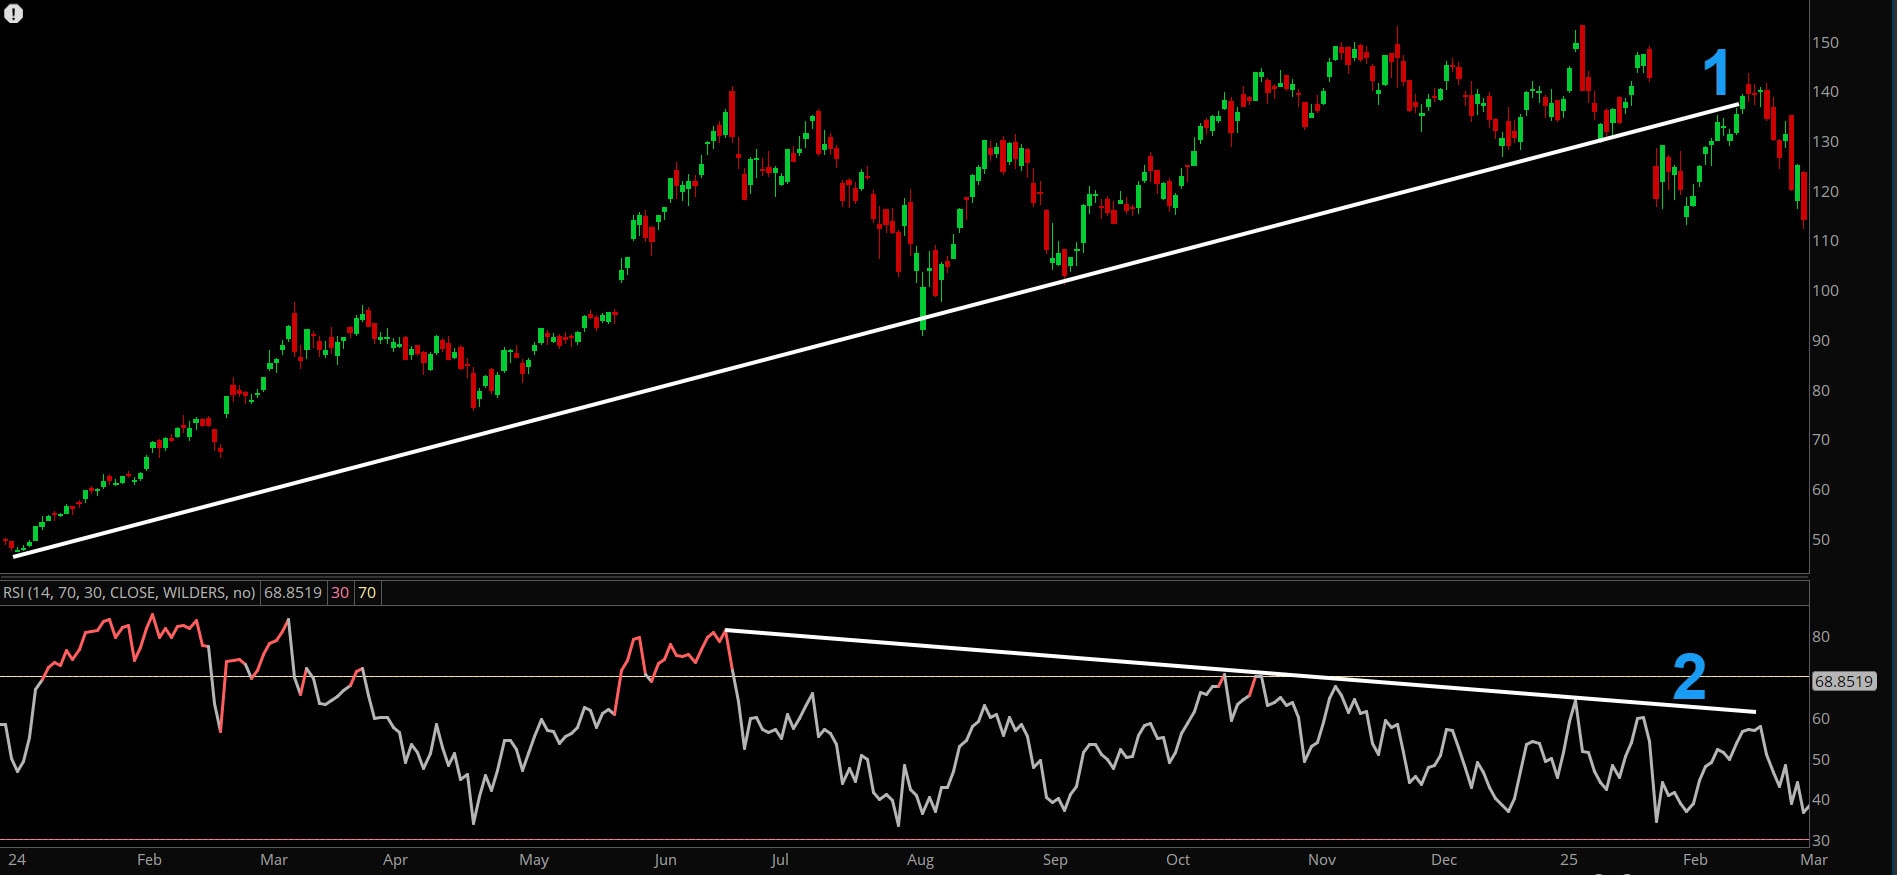
Source: thinkorswim platform
The example is hypothetical and provided for illustrative purposes only.
Adjusting for runs
One of the main risks of using the RSI is that a stock can sustain an uptrend or a downtrend for an inordinately long period. In such cases, traders might need to adjust their RSI levels higher or lower than the standard 70 and 30.
Moving the goalposts
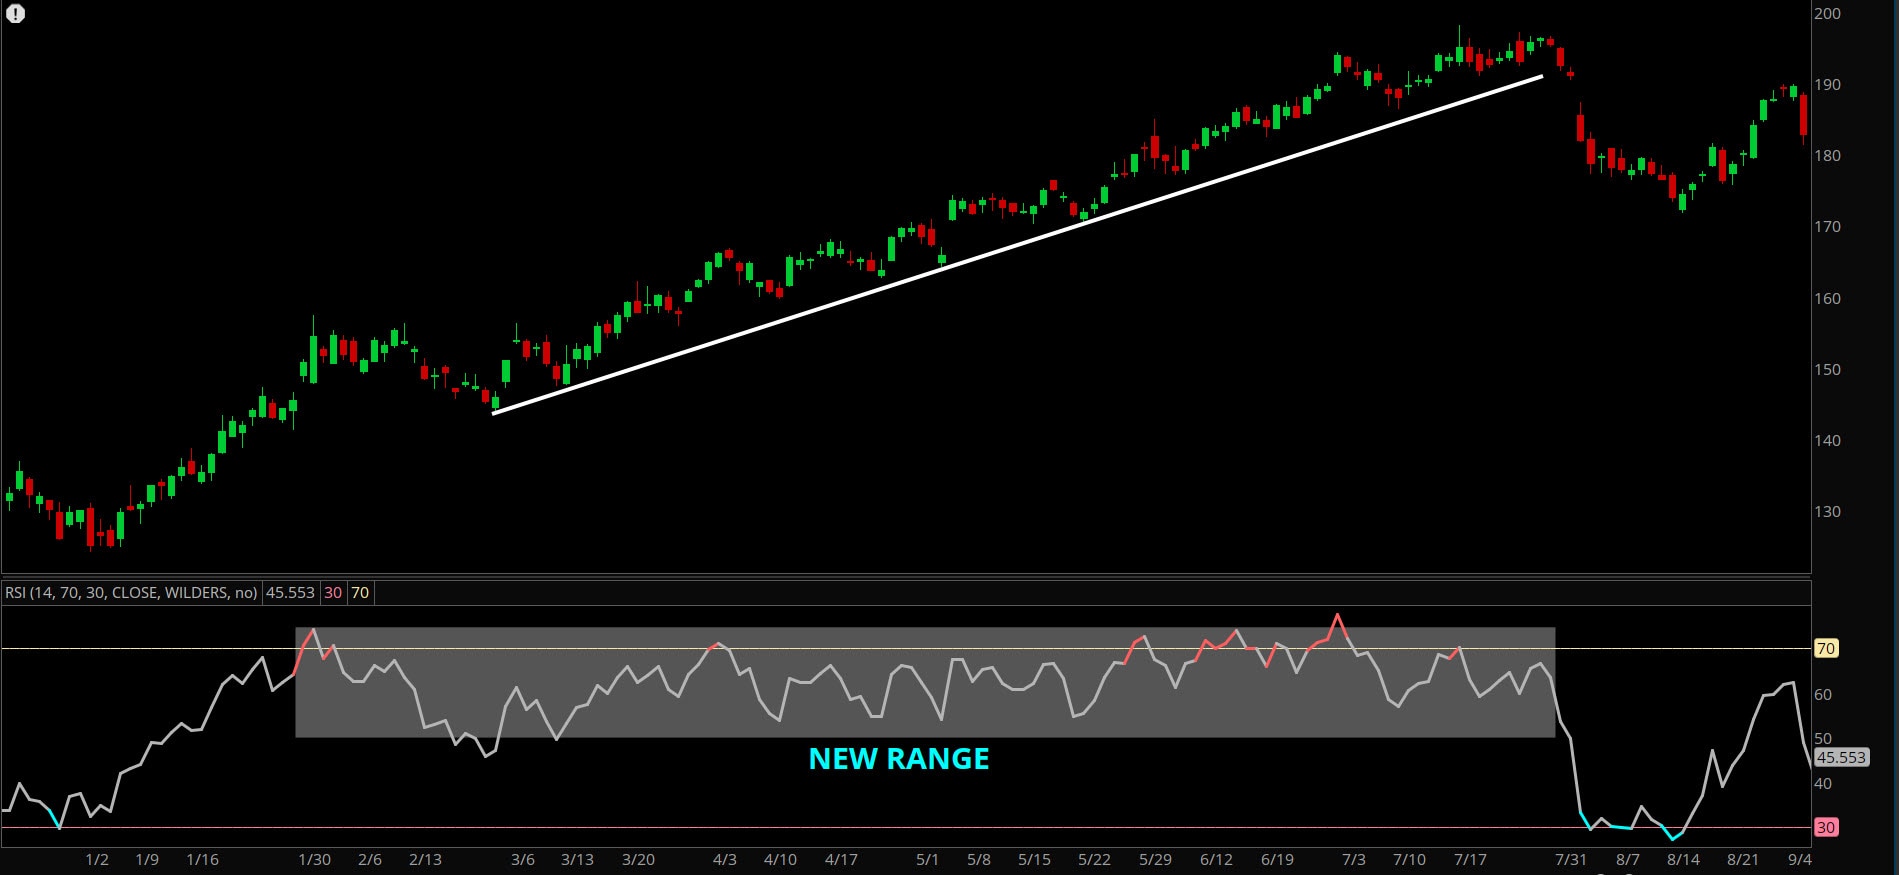
Source: thinkorswim platform
The example is hypothetical and provided for illustrative purposes only.
Start slow
As with any indicator, the RSI is far from infallible. For example, because it typically uses the past 14 days of price data, it may not reflect more immediate economic news, earnings, or other sudden forces that can affect a stock's price. Therefore, consider the following steps as you familiarize yourself with this trading tool:
- Wait for the comeback: To avoid situations where an overbought or oversold stock becomes even more so, traders may want to hold off trading as soon as a stock reaches an RSI threshold and instead wait until it crosses in the opposite direction—especially if it's been known to operate in a narrower range or regularly defy typical RSI behaviors. For example, if a trader notices that a stock's RSI is currently below 30, they might consider waiting until the RSI moves back above 30 before buying the stock.
- Scale in and out: Start with a quarter or a third of your usual trading position and add to it in increments if the stock moves as you anticipate. For example, if the RSI crosses above 30, traders might start by buying a percentage (say 25% or 33%) of their usual position size and then adding to the position if the stock price is confirming a rebound. That way, if the stock gives a false read or doesn't move as anticipated, the trader can exit the position at a relatively smaller loss.
- Look for other confirming signals: In addition to the RSI, moving averages—which help identify a stock's price trend over time—can identify support and resistance levels that, once broken, can indicate a trend is reversing. Similarly, price moves accompanied by higher-than-average trading volumes can confirm strength, while those that correspond with weak volume may lack conviction and generate a false signal.