Inflation Monitor: Pipeline Pressures Grow

Inflationary pressures are growing at every stage of the U.S. supply chain, and oil prices aren't entirely to blame.
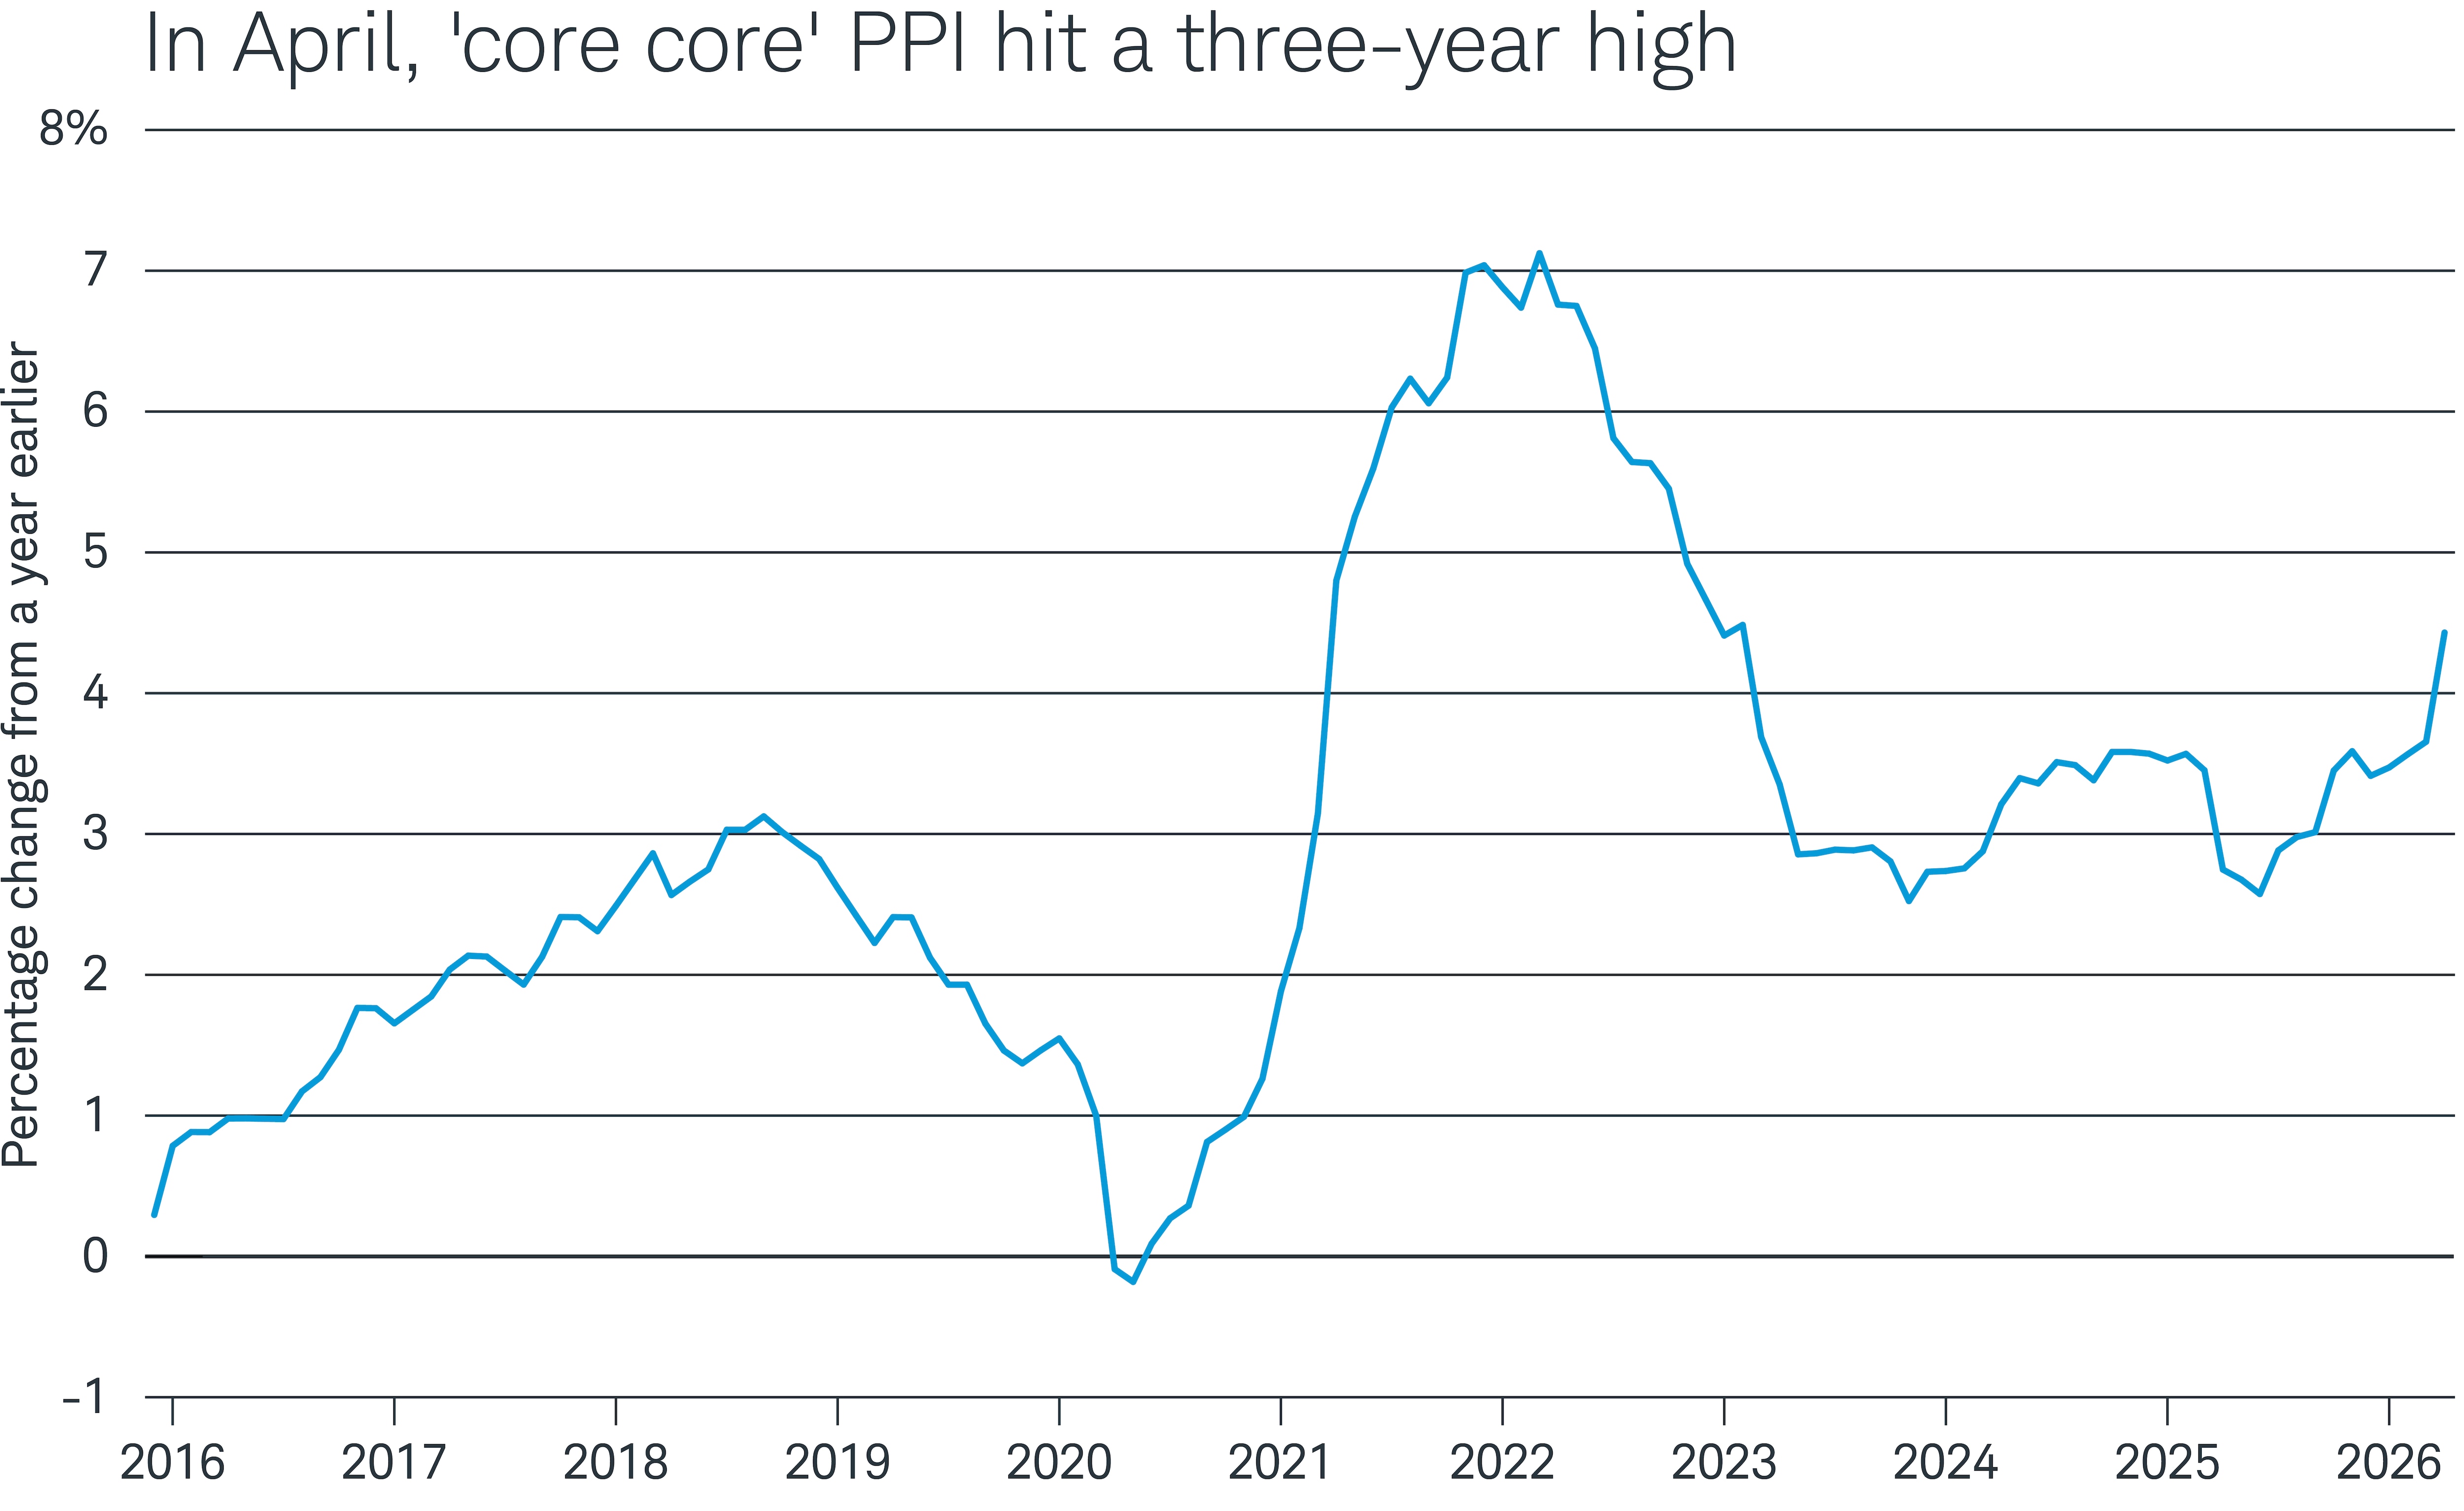
Consider the "core core" Producer Price Index (PPI), which tracks prices of "final demand" products and services excluding food, energy, and trade services. "Final demand" means one level up from consumer prices, and those prices rose 4.4% year over year in April. That was the biggest jump in three years. Outside the COVID-era inflation spike, it would have been the biggest increase since at least 2013.
But it wasn't the only notable PPI number in the latest release. Several key PPI indexes rose at the fastest pace in three or four years. The headline final demand index jumped 6.0% year over year, while final-demand goods climbed 7.4%, driven primarily by energy.
So, with Personal Consumption Expenditures (PCE) data for April due out Thursday, Federal Reserve policymakers will likely be watching warily for signs that price gains at the producer level are being passed on to consumers.
Data source: Bureau of Labor Statistics
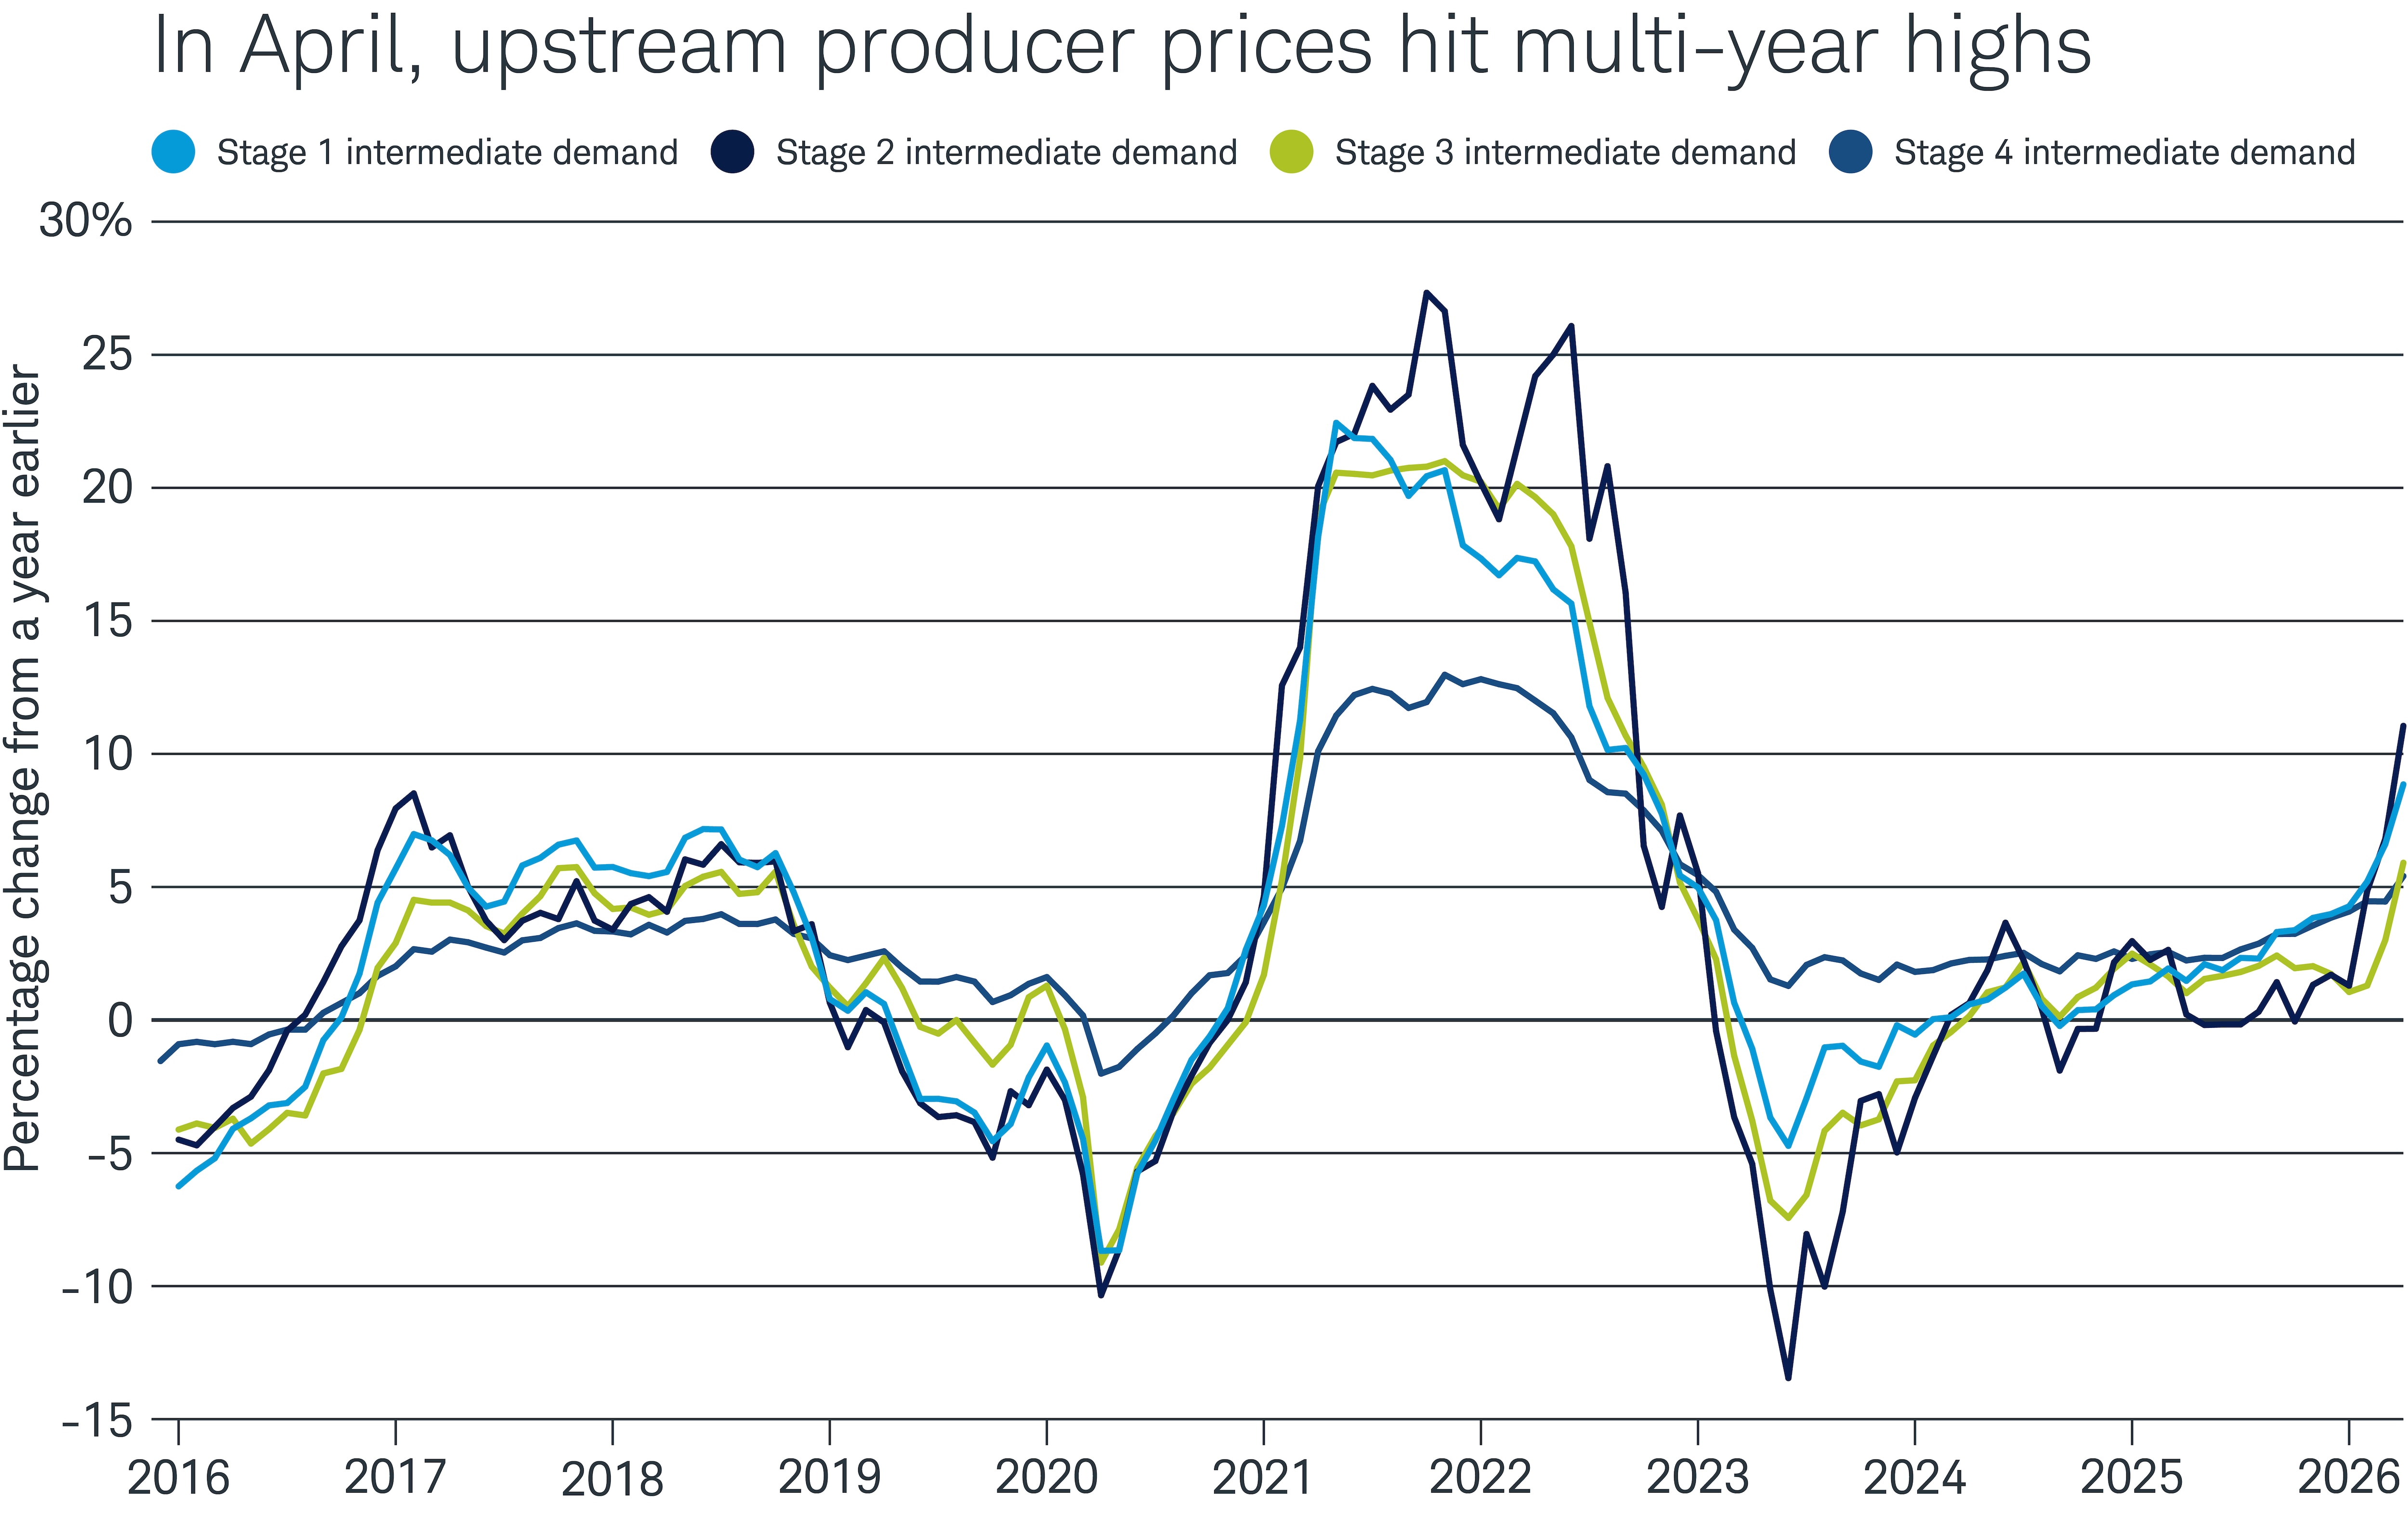
Pressure is also building further up the supply chain. As the chart below illustrates, prices at all four stages of production for intermediate demand, which are numbered according to how close they are to final demand, rose at the fastest annual pace in at least three years in April.
Data source: Bureau of Labor Statistics
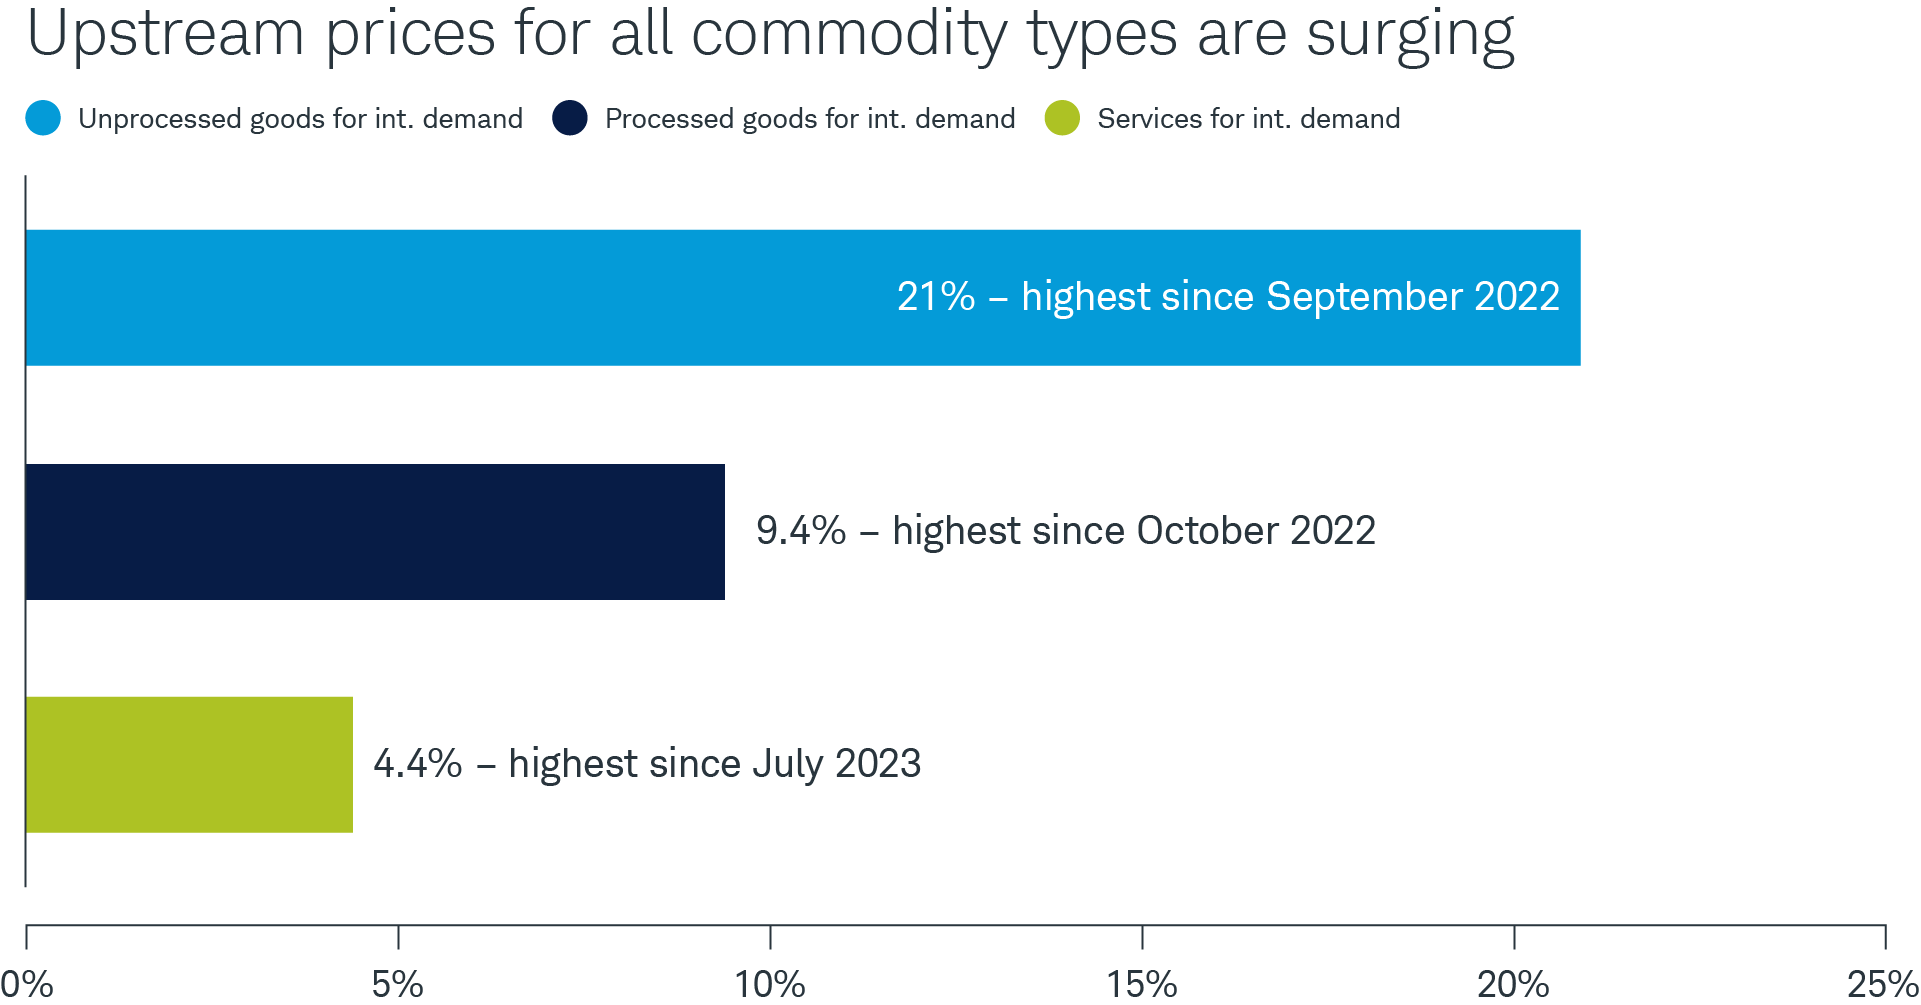
Oil prices were the biggest driver of the rise in upstream producer prices, accounting for the bulk of a 21% year-over-year jump in unprocessed goods for intermediate demand. Processed goods for intermediate demand—inputs sold to businesses—climbed 9.4% year over year, the fastest in more than three years.
Services for intermediate demand rose 4.4% year over year, the fastest pace since mid-2023, pushed higher by trade margins, freight rates, chemicals, and advertising.
That gauge may be of lasting concern to the Fed if prices continue to rise at that pace. An energy shock can fade relatively quickly if crude prices merely stabilize, but a broadening rise in non-energy input costs is the kind of pipeline pressure that can eventually feed into core PCE, the Fed's preferred inflation gauge.
Data source: Bureau of Labor Statistics