Looking to the Futures
Supply Concerns Push Crude Prices Higher

Crude oil prices rallied on Thursday after the Iran-backed Houthis launched missile and drone attacks on Saudi Arabian oil tankers in the Red Sea. Global crude supplies remain tight with the limited transport through the Strait of Hormuz. Ukraine has increased their drone attacks on Russian oil infrastructure further limiting global oil supply. Despite these attacks Russia continues to increase crude exports compared to estimates. OPEC plans to increase oil quotas over the next few months as it works to restore the 1.65 million bpd supply cutback made back in 2023. The EIA report last Wednesday was bearish for crude oil with inventories unexpectedly rising.
Crude oil prices continued to move higher on Thursday fueled by continued attacks in the Red Sea. The Houthis attacked two oil tankers linked to Saudi Arabia on Wednesday and look to blockade exports from the Red Sea. President Trump commented on Tuesday that the United States would get involved if there is a blockade in the Red Sea. The US and Iran have exchanged attacks for 12 straight days in response to the US blockade of Iranian oil shipments in the Persian Gulf. The International Maritime Organization has warned about the dangers of crossing the Strait of Hormuz and transit has dropped dramatically as Iran continues to target tankers.
Ukraine has increased drone attacks on Russian oil infrastructure further limiting global crude production. Ukrainian forces have hit at least 24 of Russia's 34 largest refineries in over 50 attacks this year, according to Bloomberg. Crude oil production in Russia fell to 8.928 million bpd in June, its lowest level in 2.5 years.
Russian crude oil exports came in greater than expected with the four-week average rising to 4.13 million bpd through June 28th. These export figures are the highest since Russia invaded Ukraine in 2022 but may be due to the country’s reduced refining capacity following the damage at its refining facilities caused by Ukrainian drone and missile attacks.
Also in the bear camp, OPEC delegates stated on May 14th that they aim to increase oil quotas over the next few months. The cartel has already agreed to restore nearly two-thirds of the 1.65 million bpd supply cutback that was made in 2023. On July 5, OPEC+ said they will increase crude output by 188,000 bpd in August, but this may prove difficult if tensions continue in the Middle East. OPEC's June crude production increased by +2.34 million bpd to 18.75 million bpd.
The EIA report was mostly negative for crude oil prices with inventories rising +2.01 million bbl against the expected decline of -1.95 million bbl. Despite that increase, US crude oil inventories were -5.3% below the seasonal 5-year average as of July 17th. US Crude oil production in the week ending July 17th dropped -0.5% w/w to 13.798 million.
On Monday Vortexa reported that crude oil stored on tankers that have been stationary for at least 7 days increased +31% w/w to 90.03 million bbl in the week ending July 17th.
Last Friday Baker Hughes reported that the number of active US oil rigs rose by +7 to 452 rigs in the week ending July 17th.
Technicals
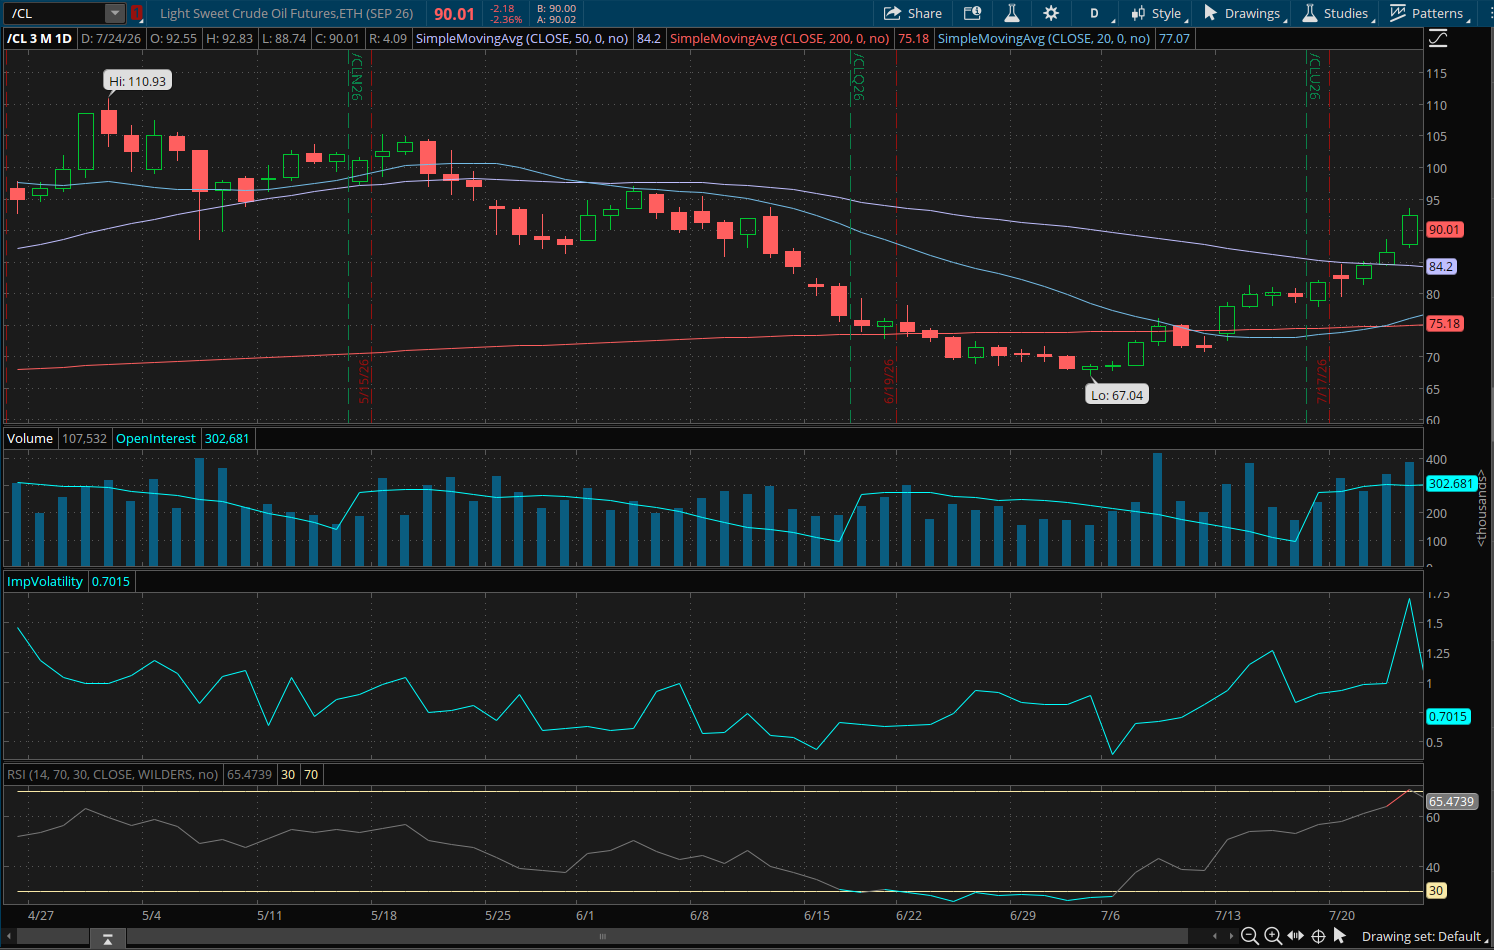
Looking at the daily chart for the Light Sweet Crude Oil September 2026 (/CLU26) contract we can see the rally in crude oil prices throughout the month of July on average trading volume. The contract traded through the 20-Day and 200-Day Simple Moving Averages and continued higher above the 50-Day SMA price point.
The Daily Technical Summary from Hightower Research has support levels at 84.34 and 82.31 with resistance levels at 88.50 and 90.64. Crude oil closed above both resistance levels during yesterday’s trading session.
According to the CFTC Commitment of Traders Report released July 14th managed money traders reduced their long position by -11,952 contracts and reduced their short position by -9,885 contracts. Managed money traders are net long 61,974 contracts.
The 14-Day Relative Strength Index at 74.09% indicates the contract has moved into overbought territory.
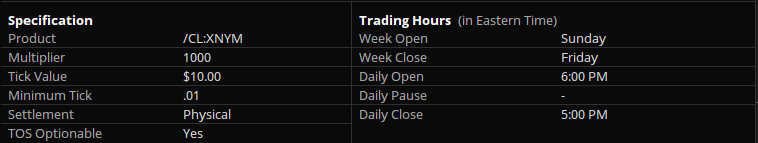
Contract Specifications
Economic Calendar
Continuing Claims 8:30 AM ET
EIA Natural Gas Inventories 10:30 AM ET
Initial Claims 8:30 AM ET
New Products
New futures products are available to trade with a futures-approved account on all thinkorswim platforms:
- Ripple (/XRP)
- Micro Ripple (/MXP)
- 100 OZ Silver (/SIC)
- 1 OZ Gold (/1OZ)
- Solana (/SOL)
- Micro Solana (/MSL)
Visit the Schwab.com Futures Markets page to explore the wide variety of futures contracts available for trading through Charles Schwab Futures and Forex LLC.