Muni Bonds: Where Are the Potential Opportunities?

Municipal bonds, or munis, are among the worst-performing fixed income asset classes this year—but we don't think that should cause investors to overlook them. They offer a compelling combination of attractive tax-adjusted yields and generally high credit quality, so they may make sense for wealthier investors looking for relatively conservative investment options.
Munis are issued by cities, states, and local governments, and they generally pay interest income that is exempt from federal taxes. In some cases, the interest income may be exempt from state and local income taxes as well.
Here are five reasons why investors should consider munis now.
1. Yields are high even though they've declined recently
Although muni bond yields have pulled back recently, they are still elevated compared to recent history. For example, the yield to worst for the Bloomberg U.S. Municipal Bond Index is about 3.5%. Although that's down from this year's high of 4.5% in April, it's still well above where it had been for most of 2010 to 2022.
Municipal bond yields remain relatively high
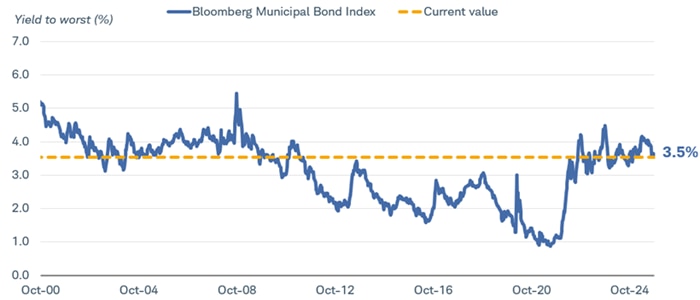
Source: Bloomberg U.S. Municipal Bond Index, weekly data from 10/23/2000 to 10/23/25.
Indexes are unmanaged, do not incur management fees, costs and expenses and cannot be invested in directly. Past performance is no guarantee of future results.
A yield of about 3.5% may not seem that attractive on the surface, but it becomes more so when accounting for the tax benefits that munis may offer. Consider that for an investor in the top tax bracket, for example, a muni yield of 3.5% is the equivalent of a roughly 6% yield on a fully taxable bond like a corporate or Treasury bond. The tax-equivalent yield is lower for investors who are not in the top tax bracket. But as illustrated in the chart below, after adjusting for a muni's tax advantage, even an investor who's not in the top federal tax bracket can obtain yields higher than many other fixed income investments.
Tax-adjusted muni yields are attractive compared to other fixed income investments
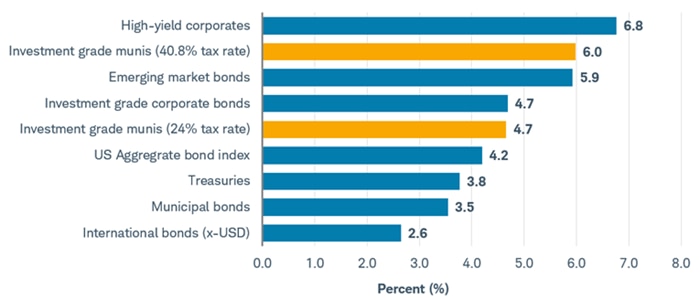
Source: Bloomberg as of 10/22/2025.
The 40.8% example assumes a 37% federal and 3.8% Net Investment Income Tax (NITT). Bloomberg U.S. Corporate High Yield Bond Index (LF98STAT Index), Bloomberg EM USD Bond Index (EMUSSTAT Index), Bloomberg U.S. Corporate Bond Index (LUACSTAT Index), Bloomberg U.S. Aggregate Bond Index (LBUSSTAT Index), Bloomberg U.S. Treasury Bond Index (LUATSTAT Index), Bloomberg U.S. Municipal Bond Index (LMBISTAT Index), Bloomberg Global Aggregate ex-USD Bond Index (LG38STAT Index). Indexes are unmanaged, do not incur management fees, costs and expenses and cannot be invested in directly. Past performance is no guarantee of future results.
2. Munis are generally highly rated
A feature of municipal bonds is that they are generally backed by stable revenue sources such as taxes or usage fees for essential services like water utilities. As a result, they are rated higher, on average, than corporate bonds and many other alternative fixed income investments. For example, about seven out of 10 investment-grade munis are rated in the top two rungs of credit quality, AAA or AA. This is much higher than the corporate bond market, where less than one out of 10 investment grade corporate bonds are rated either AAA or AA. Historically, higher-rated investments have missed interest or principal payments much less often than lower-rated investments.
Most munis are very highly rated
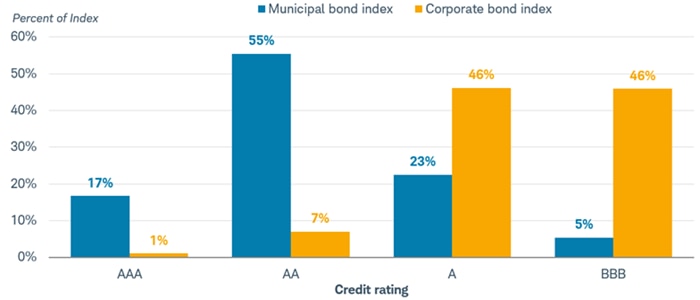
Source: Components of the Bloomberg U.S. Municipal Bond Index (LMBISTAT Index) and the Bloomberg U.S. Corporate Bond Index (LUACSTAT Index). Data as of 10/22/2025.
Indexes are unmanaged, do not incur management fees, costs and expenses and cannot be invested in directly. Past performance is no guarantee of future results.
3. We expect returns to be positive in the short term
Total returns struggled to start the year, partly due to an imbalance between supply and demand. Volatility in the broader Treasury market in April due to tariff announcements also weighed on munis. Going forward, we expect a more favorable supply-and-demand picture to develop, which should be supportive of total returns.
Monthly total returns were low in the first half of the year
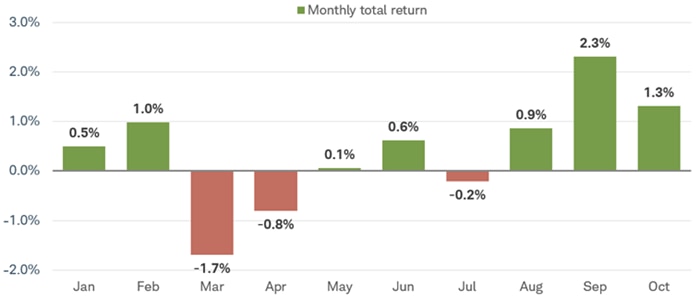
Source: Bloomberg. Bloomberg U.S. Municipal Bond Index (LMBISTAT Index). Data as of 10/22/2025.
Indexes are unmanaged, do not incur management fees, costs and expenses and cannot be invested in directly. Past performance is no guarantee of future results.
At the beginning of the year, there was some concern among muni issuers that the municipal bond tax exemption would be repealed as part of the One Big Beautiful Bill Act, the tax bill that was passed in July. If this were to have occurred, their borrowing costs would have likely increased, which would have been a negative for their finances. The tax bill didn't repeal the muni tax exemption, but speculation that it could have led many muni issuers to pull deals forward to remove the uncertainty. For example, issuance in May and June was the highest since 2010 and well above the prior months in 2025. Now that the tax bill is law and it didn't repeal the muni tax exemption, we expect issuance to decrease. This should result in a more favorable technical backdrop that is supportive of total returns in the near future.
Municipal bond issuance has been elevated this year
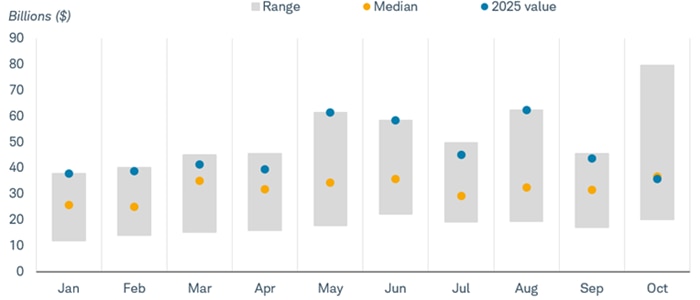
Source: Bloomberg. Bloomberg Municipal YTD Issuance Total (YTDMTOT Index).
Range bar and median dot represent issuance from 2010-2024. October values are as of 10/22/2025. Indexes are unmanaged, do not incur management fees, costs and expenses and cannot be invested in directly. Past performance is no guarantee of future results.
4. Intermediate-term and longer-term maturities are more attractive than shorter-term maturities
We believe that there are opportunities in intermediate-term and longer-term maturities now. As illustrated in the chart below, the difference between yields for AAA rated munis and Treasuries after considering the impact of taxes are higher the further out you go in maturity. For example, an index for a generic five-year AAA-rated muni yields about 25 basis points more than a Treasury bond after considering the impact of taxes. The difference in yields increases to 116 basis points and 141 basis points for 20- and 30-year maturities, respectively. One basis point is equal to 0.01%.
Yields for longer-term munis currently are high compared to Treasuries after taxes
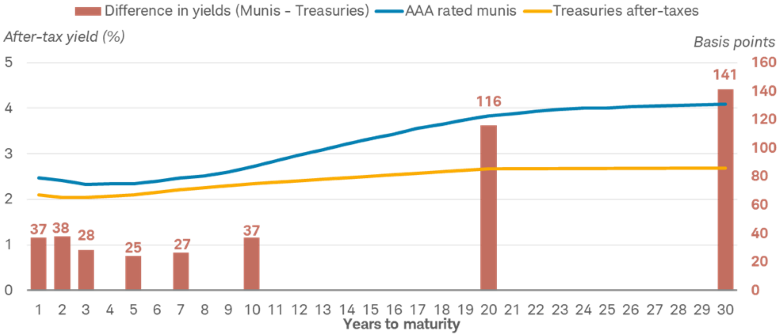
Source: Bloomberg, as of 10/22/25.
Municipal bonds are represented by the Bloomberg Evaluated Pricing Solutions (BVAL) AAA Muni Yield Curve. It is populated with high-quality U.S. municipal bonds with an average rating of AAA from Moody's and S&P. Treasuries assume a 37% and 3.8% Net Investment Income Tax (NITT). All names and market data shown are for illustrative purposes only and are not a recommendation, offer to sell, or a solicitation of an offer to buy any security. Past performance is no guarantee of future results.
Additionally, Federal Reserve interest rate cuts may weigh on short-term yields. Short-term yields are highly correlated with the fed funds rate, and we expect the Fed to cut its benchmark interest rate this year and into next year, which should pull short-term yields lower. Investors who have been holding larger allocations to short-term bonds may soon be faced with the prospects of lower yields due to Fed rate cuts.
We don't believe that most investors should focus all or the majority of their portfolio on very long-term maturities. Longer-term bonds are much more sensitive to changes in interest rates than shorter-term bonds; if longer-term yields increase, prices of longer-term bonds would likely decline more than short-term bonds. Instead, a combination of some short-term and longer-term bonds is a good starting point for most investors when it comes to investing on the yield curve. For the average muni investor, an average duration of about six to seven years is a good starting point in our view.
5. Munis can help diversify a portfolio
Historically, total returns for municipal bonds have been less volatile than returns for riskier investments such as equities. For example, annual returns over the past 30 years for municipal bonds have ranged between roughly –9% and 18% compared to roughly –37% and 38% for the S&P 500® Index. As shown in the chart below, combining municipal bonds with a more volatile investment like equities reduces the upside of the portfolio but can also diminish the downside. We believe that investors with a lower tolerance for portfolio volatility may want to consider an allocation to municipal bonds if it fits their risk tolerance.
An allocation to municipal bonds can help reduce the downside of a portfolio
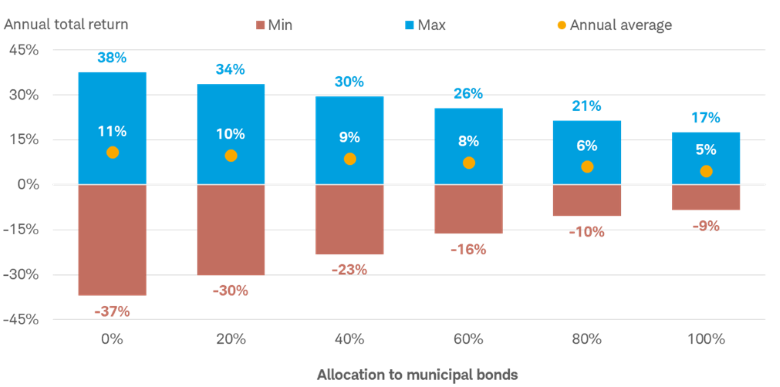
Source: Bloomberg U.S. Municipal Bond Index (LMBISTAT Index) and the S&P 500® Index (SPX Index).
The chart shows the best calendar year, worst calendar year, and average annual total return from 12/30/94 to 12/31/24. The hypothetical portfolio only assumes an allocation to municipal bonds or equities, as represented by the S&P 500. This hypothetical example is only for illustrative purposes. Past performance is no guarantee of future results.
What to consider now
We believe that higher-income earners should consider municipal bonds because they currently offer attractive yields and are generally high-credit quality. They do carry some risks, however.
Like other bonds, munis have interest-rate risk, which means that if rates rise, prices for municipal bonds will falter. Additionally, even though municipal bonds are generally highly rated, defaults can occur. These are rare with investment-grade munis and occur less frequently than with corporate bonds. Lastly, the municipal bond market is much smaller than the corporate bond and Treasury markets, which may exacerbate price volatility during times of market stress.