2026 Outlook: Municipal Bonds

Key takeaways
- Yields should continue to remain attractive in 2026—especially when factoring in taxes. We expect short-term yields to move lower, but longer-term yields are likely to remain elevated.
- The key for performance in 2026 will be demand. We expect another year of elevated issuance and if demand doesn't keep pace, total returns for munis may lag.
- Credit quality should remain stable. Growth in tax revenues surged in 2021 and 2022 but have since come back down to their longer-term average. Many states used the increase in tax revenues to build up their liquidity positions which will help offset an economic slowdown if there is one.
In 2026, we think municipal bonds will continue to offer attractive tax-adjusted yields and credit quality should remain stable. In our view, munis can be an attractive investment option for investors in higher tax brackets looking for relatively conservative investment options and we don't expect that to change in the near future.
The key for performance next year will be demand. We expect another year of elevated issuance and if demand doesn't keep pace, total returns for munis may lag other comparable fixed income investments, as they have so far this year. So far, 2025 has been characterized by a record amount of issuance due to concerns about the muni tax exemption being repealed, higher inflation costs resulting in higher infrastructure costs, and other factors. Even though major tax law changes likely won't be an issue in 2026, issuance should remain elevated.
Investment-grade and high-yield muni returns have lagged year to date

Source: Bloomberg. Total returns from 12/31/2024 through 11/28/2025.
Indexes representing the investment types are: EM (USD) = Bloomberg Emerging Markets USD Aggregate Bond Index; Securitized = Bloomberg US Securitized Index; Int. developed (x-USD) = Bloomberg Global Aggregate ex-USD Bond Index; HY Corporates = Bloomberg US High Yield Corporate Bond Index; IG Corporates = Bloomberg U.S. Corporate Bond Index; US Aggregate = Bloomberg U.S. Aggregate Index; TIPS = Bloomberg US Treasury Inflation-Protected Securities (TIPS) Index; Treasuries = Bloomberg U.S. Treasury Index; Bank loans = Morningstar LSTA US Leveraged Loan 100 Index; Agencies = Bloomberg U.S. Agency Bond Total Return Index; Preferreds = ICE BofA Fixed Rate Preferred Securities Index; Munis = Bloomberg US Municipal Bond Index. Total returns assume reinvestment of interest and capital gains. Indexes are unmanaged, do not incur management fees, costs, and expenses, and cannot be invested in directly. Past performance is no guarantee of future results.
So far in 2025, performance for munis maturing in seven to 10 years outperformed both shorter- and longer-term munis. Regarding credit quality, most credit rungs of the investment-grade muni space performed close to one another but high-yield was the clear laggard. For example, Baa rated munis are up 4.1% year-to-date, equal to AAA rated munis, which are up 4.1% year to date.1 However, high-yield munis are only up 2.7% year to date. High-yield munis trailed investment-grade munis because some large high-yield issues experienced financial difficulties, which led to large declines for their outstanding bonds and dragged the rest of the index lower.
Components of the Bloomberg Municipal Bond Index
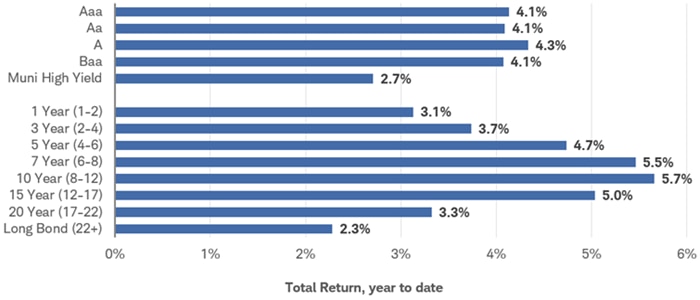
Source: Components of the Bloomberg Municipal Bond Index. As of 11/28/2025.
Total returns assume reinvestment of interest and capital gains. The Moody's investment-grade rating scale is Aaa, Aa, A, and Baa, and the sub-investment-grade scale is Ba, B, Caa, Ca, and C. Indexes are unmanaged, do not incur management fees, costs and expenses, and cannot be invested in directly. Past performance is no guarantee of future results.
Yields should continue to remain attractive—especially when factoring in taxes, which is beneficial for investors who are primarily focused on income. For example, the yield-to-worst (the lowest possible yield an investor can receive from a callable bond, barring default) for the Bloomberg Municipal Bond Index, which is a broad index of munis, is 3.6%. Although that's generally lower than many other comparable fixed income alternatives, like Treasuries or investment-grade corporate bonds, it's because the interest income munis pay is usually exempt from federal and potentially state income taxes. If that 3.6% yield were to be fully taxable for an investor in the top tax bracket, which is currently 37% plus the 3.8% Net Investment Income Tax (NIIT), that's the equivalent of a roughly 6.1% yield. This is called the tax-equivalent yield.
Munis aren't just attractive for investors in higher tax brackets—we believe they can also make sense for investors in lower tax brackets. Going back to the 3.6% yield for the broad index, that's the equivalent of 4.7% yield for a fully taxable bond at the 24% tax rate. It's also worth noting that these calculations don't include a state tax. For investors in high-tax states, like California or New York, including a state tax rate will result in an even higher tax-equivalent yield.
Muni yields are attractive relative to alternatives after adjusting for taxes
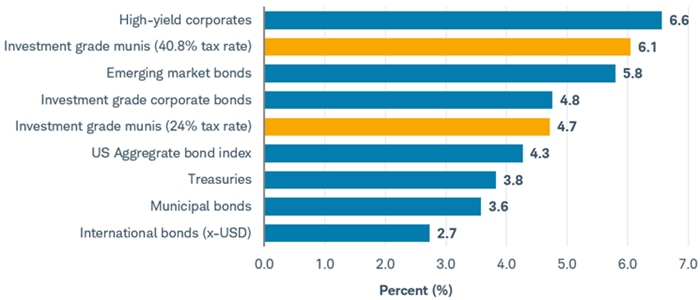
Source: Bloomberg as of 11/28/2025.
Indexes representing the investment types are: High-yield corporates = Bloomberg US Corporate High Yield Bond Index; Investment grade munis = Bloomberg Municipal Bond Index (40.8% tax rate includes 37% tax rate plus 3.8% NIIT, calculation does not include a state income tax); Emerging market bonds = Bloomberg EM USD Bond Index; Investment-grade corporate bonds = Bloomberg US Corporate Bond Index; US Aggregate bond index = Bloomberg US Aggregate Bond Index; Treasuries = Bloomberg US Treasury Bond Index; Municipal bonds = Bloomberg Municipal Bond Index; International bonds (x-USD) = Bloomberg Global Aggregate ex-USD Bond Index. Indexes are unmanaged, do not incur management fees, costs and expenses, and cannot be invested in directly. Past performance is no guarantee of future results.
In 2026, we expect intermediate- and longer-term muni yields to remain elevated but short-term yields, which are highly correlated to the federal funds rate, are likely to move lower. We believe that the Federal Reserve will continue to cut interest rates but likely at a slow and methodical pace. This should pull down yields for short-term bonds. However, longer-term yields will likely remain elevated.
For most fixed income investors, we suggest targeting a benchmark duration and focusing on higher-rated issuers. This guidance also applies to the muni market. For most muni investors, an average duration of about six years is a good starting point, in our opinion. A good strategy can be a bond ladder. This can help spread the duration risk across the yield curve. For investors who are more tactical and willing to take on some duration risk, we think a barbell strategy may make sense. A barbell strategy combines some short-term bonds with some longer-term bonds while avoiding bonds in the middle part of the curve. However, both strategies come with risks. A risk of both strategies is that if rates rise the prices of the bonds generally will drop, which could result in a loss. This can be more pronounced with a barbell strategy because there's a larger weighting to longer-term bonds and prices of longer-term bonds tend to be more sensitive to changes in interest rates. Additionally, both are strategies that involve investing in bonds, and bonds have certain risks such as default risk and inflation risk.
Currently, the difference in yields between longer-term munis and Treasuries after taxes is higher for longer-term munis than it is for short-term munis. For example, as illustrated in the chart below, an index of two-year AAA rated muni yields 40 basis points more than a two-year Treasury after factoring in taxes. This difference in yields increases to 110 basis points for 20-year munis and is even greater for 30-year munis. A barbell strategy can take advantage of the more attractive yields on the longer end of the curve while also sticking close to a benchmark duration if combined with some short-term bonds. It's worth mentioning that longer-term bonds are much more sensitive to changes in interest rates. If rates rise, prices for longer-term bonds will fall much more than prices for short-term bonds and investors could experience negative total returns.
Currently, longer-term munis yield much more than Treasuries after taxes
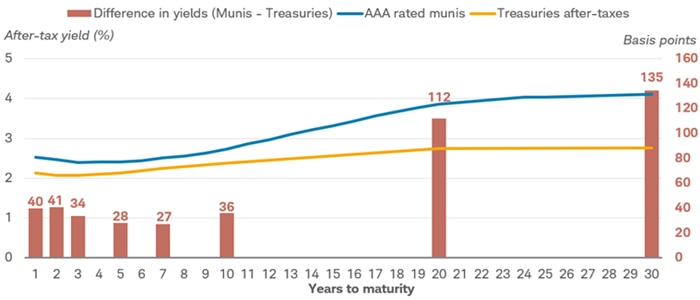
Source: Bloomberg, as of 11/28/2025.
Municipal bonds are represented by the Bloomberg BVAL Muni AAA Yield Curve. Treasuries assume a 37% tax rate and 3.8% NIIT. For illustrative purposes only. Past performance is no guarantee of future results. The BVAL Muni AAA Yield Curve is the baseline curve for BVAL tax-exempt munis. It is populated with high quality U.S. municipal bonds with an average rating of AAA from Moody's and S&P. The yield curve is built using non-parametric fit of market data obtained from the Municipal Securities Rulemaking Board, new issues calendars, and other proprietary contributed prices. Represents 5% couponing.
Demand should take center stage in 2026
The big story in 2025, which we expect to continue into 2026, was the record amount of issuance. As of November 14th, 2025, there had been more than $500 billion issued, surpassing the total issuance for 2024 even with a month and a half left in the year. Issuance in 2025 was 45% higher than the average from 2004 through 2024. Although the amount of issuance will likely remain elevated next year, we believe the pace of issuance will not be as high as in 2025. This matters because prices for munis are impacted by supply and demand dynamics. If supply is elevated but demand cannot keep pace, prices could decline or not increase as much as other fixed income investments.
Issuance was elevated in 2025
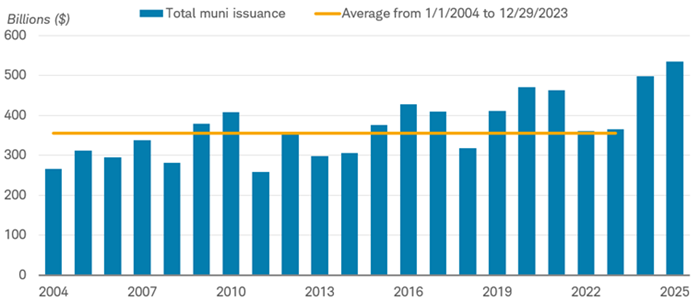
Source: Bloomberg Municipal YTD Issuance Total (YTDMTOT Index). As of 11/28/2025.
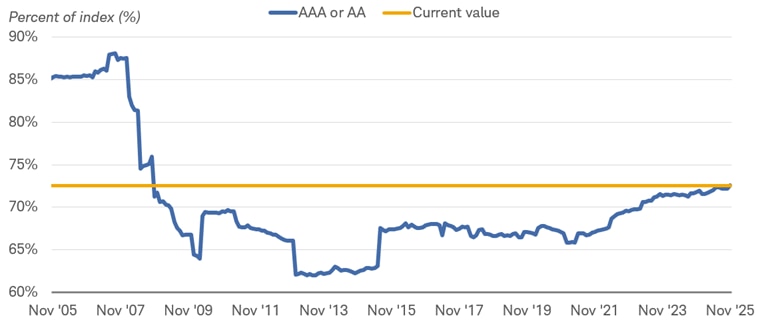
A key tenet of municipal bonds is their high and stable credit quality and we don't expect that to change in the near future. Many municipal bonds are directly or indirectly backed by stable revenue sources such as income, sales, property, or other taxes or usage fees. These are revenue sources that generally don't fluctuate that much. Partly as a result, most municipal bonds are very high credit quality to begin with. In fact, nearly three out of four bonds in the Bloomberg Municipal Bond Index are either AAA or AA rated, the two highest rungs of investment grade. This is close to the highest proportion going back to early 2009. Generally speaking, higher rated issuers are less prone to missing principal and interest payments and the prices of their bonds tend to be less volatile than lower rated bonds.
Proportion of AAA or AA rated munis in the index
Source: Components of the Bloomberg Municipal Bond Index. Monthly data as of 11/28/2025.
At the end of 2019, shortly before COVID-19 pandemic became a global pandemic, roughly 67% of the munis in the index were either AAA or AA rated. That has since risen to 72% as of the end of October 2025. Part of the reason for the improvement in credit quality was because there was a surge in tax revenues in 2021 and 2022. As illustrated in the chart below, tax revenues have increased by more than 20% since the onset of the pandemic. Although the pace of revenue growth has slowed recently, it is still positive and close to the longer-term average.
State tax revenues are very close to their long-term average

Source: U.S. Census. Quarterly data from Q4 1995 to Q2 2025, which is the most recent data available.
Rolling average is a 4-quarter rolling average. Average between Q4 1995 to Q2 2025 excludes Q1 2021 to Q4 2022 to smooth the effect of the surge in tax revenues.
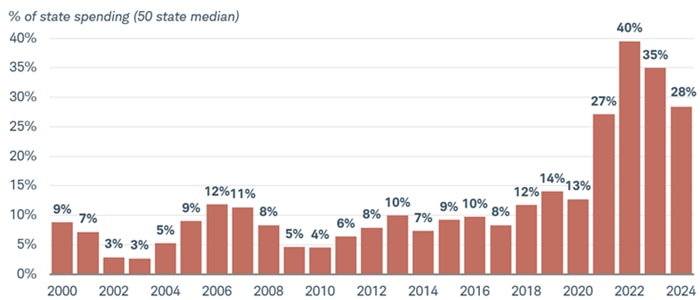
We don't expect the economy to slow significantly, which should bode well for state tax revenues. However, even if the economy slows and tax revenues dwindle, many states and local governments are still well positioned to weather a slowdown because they used the surge in tax revenues to build up their rainy-day funds. For example, in 2019, the median state rainy-day fund was 14% of a state's total spending. That surged in 2021 and was 28% in fiscal year 2024.
States used higher revenues to shore up rainy-day funds
Source: Pew Charitable Trusts, as of 3/27/2025.
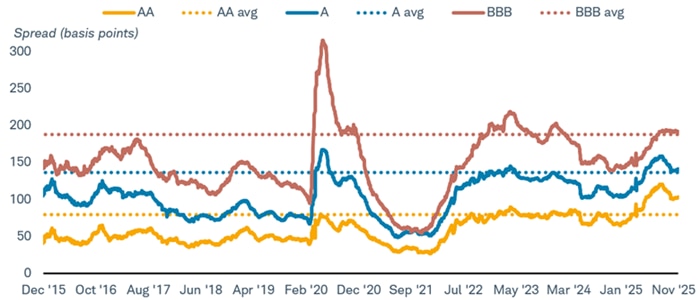
Although we don't have any major concerns about credit quality, we think investors should focus on higher-rated issuers because spreads for lower-rated issuers aren't that attractive. A spread is the additional yield that a lower-rated bond pays compared to a higher-rated issuer. For example, as illustrated below, an index of BBB rated municipal bonds yields 1.92% (192 basis points) more than an index of AAA municipal bonds. That's only four basis points above its average over the past three years. However, spreads for AA rated issuers are 19 basis points more than their three-year averages. Even though we believe that the bulk of a muni bond portfolio should be in higher-rated issuers, a small allocation to some lower-rated investment-grade issuers can be appropriate for some investors because they have higher yields, on average, which can help boost investment income.
Spreads for higher rated munis are above their 3-year average
Source: Components of the Bloomberg Municipal Bond Index. Daily data as of 11/24/25.
Average is from 1/1/09 to 11/24/25 using daily data. Spread is calculated as the difference in yield to worst between the AA, A, or BBB components of the Bloomberg Municipal Bond Index and the BVAL Muni AAA Yield Curve 6Y, which is the 6-year portion of the BVAL Muni AAA Yield Curve. Total returns assume reinvestment of interest and capital gains. Indexes are unmanaged, do not incur management fees, costs and expenses, and cannot be invested in directly. Past performance is no guarantee of future results. For illustrative purposes only. The BVAL Muni AAA Yield Curve is the baseline curve for BVAL tax-exempt munis. It is populated with high quality U.S. municipal bonds with an average rating of AAA from Moody's and S&P. The yield curve is built using non-parametric fit of market data obtained from the Municipal Securities Rulemaking Board, new issues calendars, and other proprietary contributed prices. Represents 5% couponing.
What to consider now
For investors looking for a relatively stable investment option that also has tax advantages, we think munis are worth consideration. They currently offer yields that are comparable to other investments after considering the impact of taxes, but generally with less volatility. We think credit quality should remain stable in 2026 but believe that most muni investors should focus the bulk of their portfolio on higher-rated issuers. We would not be surprised if demand stays positive, which should help support total returns next year. For help selecting investment options given your situation and preferences, reach out to your Schwab representative or find a Schwab Financial Consultant.
1 The Moody's investment-grade rating scale is Aaa, Aa, A, and Baa, and the sub-investment-grade scale is Ba, B, Caa, Ca, and C. Standard and Poor's investment-grade rating scale is AAA, AA, A, and BBB and the sub-investment-grade scale is BB, B, CCC, CC, and C. Ratings from AA to CCC may be modified by the addition of a plus (+) or minus (-) sign to show relative standing within the major rating categories. Fitch's investment-grade rating scale is AAA, AA, A, and BBB and the sub-investment-grade scale is BB, B, CCC, CC, and C.