Price Movement Indicator: Market Maker Move

When trading short-term fluctuations, it can be difficult to profit from a stock or option that doesn't move. But an unexpected spike in implied volatility (IV) can also potentially wreak havoc on a portfolio or trading strategy. IV is a changeable measure that reflects the market's perception of future volatility in the underlying security, as directly reflected in the options premium. Traders can attempt to guard against unexpected spikes—and potentially use them to their advantage—by monitoring the Market Maker Move™ (MMM) indicator on the thinkorswim® platform.
What is the Market Maker Move?
The Market Maker Move (MMM) uses some of the same inputs that market makers do, such as stock price, volatility differential, and time to expiration. A proprietary calculation then reverse-engineers the options pricing model based on assumptions about IV, creating an estimate of potential daily price movement.
Note that the MMM value does not guarantee a stock will move by a certain magnitude, nor does it indicate in which direction a move might occur. It only means the options market has priced in an expected move—up or down—over and above that of a typical trading day.
Let's look at an example. Stock ZYX is trading at $100 and has an MMM of ±10. This tells the trader the options market has priced in a $10 move, whether as low as $90 or as high as $110, due to an upcoming event like earnings. Of course, there are no guarantees. The actual move could be more or less, up or down, or there could be no reaction at all.
What if there isn't a MMM value?
In many instances, there's no MMM value present. This reading only shows up when "excess volatility" is detected. Typically, that means the IV in the current-week options expiration is higher than that of the next expiration date.
If there's currently an MMM, it will appear on thinkorswim under the Trade tab > All Products. The MMM is shown on the same line as the symbol box to the right of the bid and ask and the exchange.
If MMM isn't showing up, it means the options market isn't pricing in any excess volatility. In normal markets, IV is lower in the front-month options contract than it is in later months. When the market is pricing in a potentially outsized move, such as right before an earnings release or other company announcement, front-month IV might be higher. That's when the MMM is displayed, as shown in the image below.
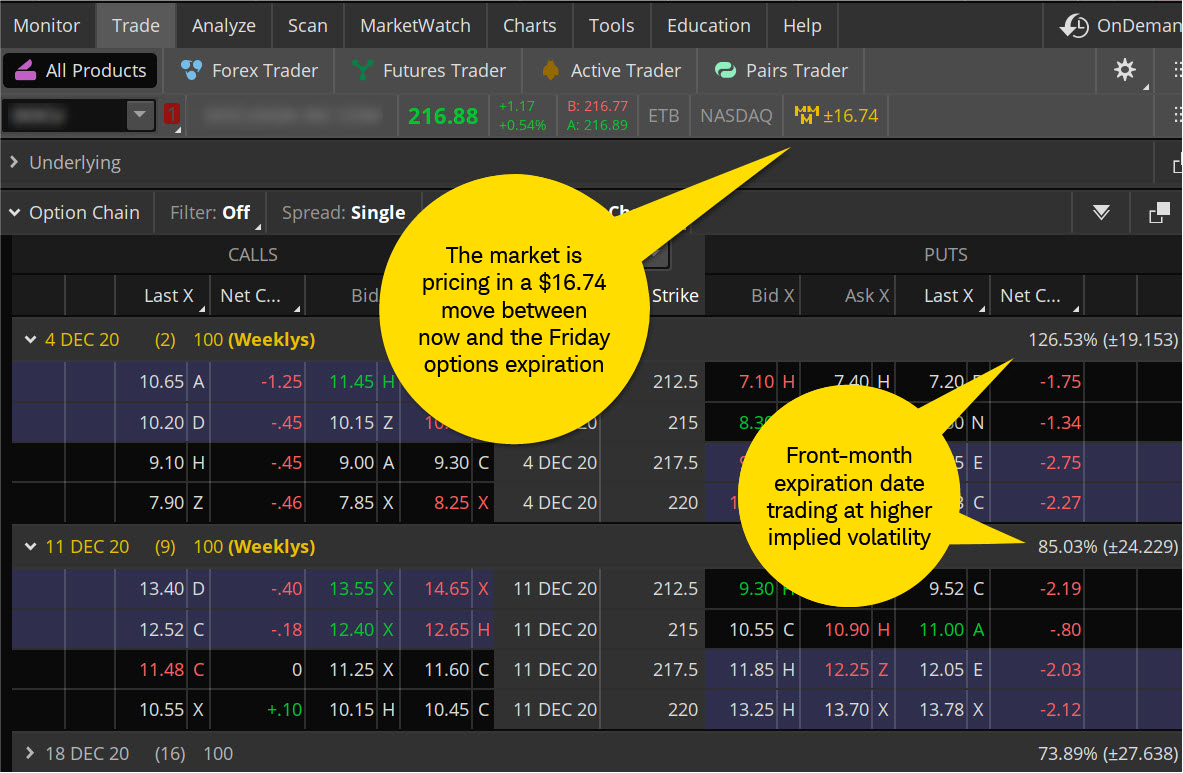
Source: thinkorswim platform
For illustrative purposes only. Screenshots are historical in nature.
The image above shows a stock trading at $216.88 with an MMM of ±16.74. This indicates the options market has priced in a move to as low as $200.14 and as high as $233.62.
The MMM can be a powerful tool for traders during events like:
- Earnings season, especially when holding shares of a company that's about to report.
- Pending company news, such as a new product release, potential merger/acquisition talks, or legal/regulatory action.
How to use the MMM during earnings
When trading around earnings, there are some strategies that the MMM can potentially help with:
- Risk budgeting. Checking the MMM on an existing position ahead of earnings might be a good way to decide if it's worth the risk to hold through the event. For example, if a stock is trading at $216 with an MMM of ±5.4, a trader might be comfortable with the potential event risk of 2.5%. The image above, though, shows MMM is implying a potential 7.7% move of ±16.74. Whether or not to hold in this situation depends on the trader's overall risk tolerance.
- Picking points. When reviewing a chart and trying to decide an entry or exit point, the MMM might add a level of possible validation to the entry point, profit target, or stop-order level. Remember, though, if a stop order is triggered, it competes with other market orders.
- Choosing options strikes. Some option traders might use an iron condor—a four-contract strategy that combines a short put vertical and a short call vertical—in an attempt to capitalize on the expected collapse of IV that can often come after the market's initial reaction to earnings releases. In this instance, a trader might set strikes outside the MMM range. Or, if a trader wanted to put on a purely directional trade using a put or call, they could compare the at-the-money (ATM) options to the MMM. For example, if the ATM options are trading equal to or more than the MMM, they'd have a lower chance of profiting on the trade. But if the ATM is trading for less than the MMM—implying a potentially larger move than is being priced in—it might be a trade worth considering.
The MMM can be a helpful tool to inform a trader's strategy. However, it's important to remember it is a probabilistic measure that reflects the expectation of the potential magnitude (but not direction) of market movement. Even so, it can be a data point that helps traders make more informed trading decisions.