Quiz: Test Your Trading Smarts

Question 1
Having purchased a stock based on extensive research, a trader then ignores negative news, refusing to sell even as the stock trends lower. This behavior is an example of:
A. Anchoring bias
B. Confirmation bias
C. Loss aversion
D. Recency bias
Answer 1: B
The tendency to favor information that supports our existing beliefs while ignoring contradictory evidence is known as confirmation bias. Traders can avoid this problem by asking whether the initial factors supporting their decision are still relevant—for example, by seeking out reputable views that contradict their own. If they cannot make a data-backed rebuttal to the opposing view, they're likely being blinded by bias.
For more on the behavioral biases that may be costing you money, subscribe to Schwab's Choiceology podcast.
Question 2
True or False: The securities market is generally less volatile outside normal trading hours.
A. True
B. False
Answer 2: B
Outside normal trading hours, markets operate with fewer participants; indeed, the New York Stock Exchange estimates extended hours currently account for only about 11% of all U.S. equity trading.1 With fewer buyers and sellers, even modest orders can move prices sharply and widen bid-ask spreads, resulting in orders being filled at less-than-optimal prices. After-hours sessions also are more prone to information shocks, since company news, earnings announcements, and economic data are often released after normal trading hours. Traders can manage these after-hours risks by trading smaller positions, using limit orders instead of market orders when buying, and setting alerts for manual monitoring of active holdings.
Learn more about extended hours trading at Schwab.
Question 3
True or False: A stop limit order, which guarantees the limit price or better, eliminates the chance of loss.
A. True
B. False
Answer 3: B
Unlike standard stop orders, a stop limit order requires both a stop price and a limit price. When the stock price reaches the stop level, it triggers the order to buy or sell at the specified limit price or better. However, execution is not guaranteed; if the market moves too quickly, the stock's price could gap past the limit price without fulfilling the trade. "Stop limit orders aren't an insurance policy," says Kevin Horner, a senior manager of trader education at Schwab. "They're best used as a tactical tool in highly liquid but slow-trending markets."
" id="body_disclosure--media_disclosure--636146" >Unlike standard stop orders, a stop limit order requires both a stop price and a limit price. When the stock price reaches the stop level, it triggers the order to buy or sell at the specified limit price or better. However, execution is not guaranteed; if the market moves too quickly, the stock's price could gap past the limit price without fulfilling the trade. "Stop limit orders aren't an insurance policy," says Kevin Horner, a senior manager of trader education at Schwab. "They're best used as a tactical tool in highly liquid but slow-trending markets."
Question 4
The following stock chart depicts which technical trading pattern?
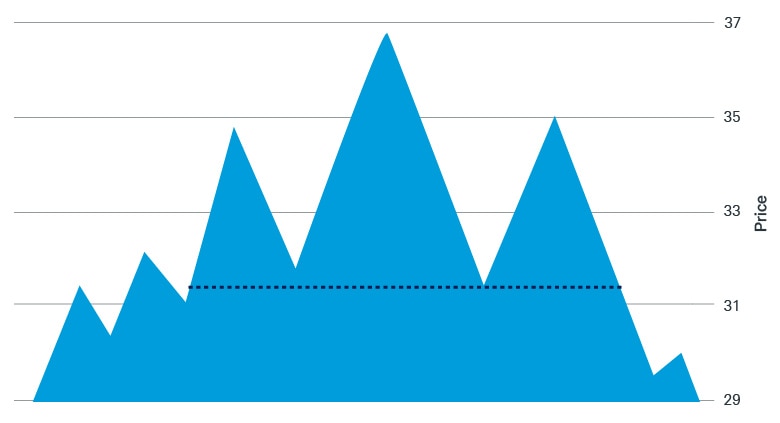
For illustrative purposes only.
A. Ascending triangle
B. Descending triangle
C. Head and shoulders
D. Triple top
Answer 4: C
A head-and-shoulders pattern displays a central peak flanked by two smaller peaks. It can be a useful indicator of a major trend reversal, but it is also easy to misread. The confirming signal is provided by a fourth component—the neckline—which is formed by drawing a line underneath the troughs established before and just after the head. When the stock's price drops below this line, traders usually read it as a strong indicator that a bullish pattern has been broken.
Question 5
What's your potential loss on a short position?
A. 25%
B. 50%
C. 100%
D. Limitless
Answer 5: D
Learn more about the ins and outs of short selling.
" role="dialog" aria-label="When a trader shorts a stock, they're attempting to profit from a decline in its price. To do this, a trader borrows shares from their broker using a margin account (see "Question 6") and immediately sells them at the current market price, with the goal of repurchasing them at a lower price and pocketing the difference. However, if the price rises, the trader is still obligated to repurchase and return the shares, and every dollar above the price at which they sold the borrowed shares is a dollar lost—with no limit to how high the price can go. Consider the example of a trader who shorts 100 shares of a stock at $50, generating $5,000 in proceeds. If the stock drops to $25 and they repurchase the shares at that price, they earn a profit of $2,500. However, if the shares climb to $75 instead, buying them back costs $7,500, which generates a $2,500 loss—with higher prices generating even bigger losses.
Learn more about the ins and outs of short selling.
" id="body_disclosure--media_disclosure--636256" >When a trader shorts a stock, they're attempting to profit from a decline in its price. To do this, a trader borrows shares from their broker using a margin account (see "Question 6") and immediately sells them at the current market price, with the goal of repurchasing them at a lower price and pocketing the difference. However, if the price rises, the trader is still obligated to repurchase and return the shares, and every dollar above the price at which they sold the borrowed shares is a dollar lost—with no limit to how high the price can go. Consider the example of a trader who shorts 100 shares of a stock at $50, generating $5,000 in proceeds. If the stock drops to $25 and they repurchase the shares at that price, they earn a profit of $2,500. However, if the shares climb to $75 instead, buying them back costs $7,500, which generates a $2,500 loss—with higher prices generating even bigger losses.
Learn more about the ins and outs of short selling.
Question 6
Which of the following statements about trading on margin is true?
A. If the securities being used as collateral lose value, the trader must either repay the brokerage or deposit more money into the account.
B. Interest on margin loans accrues monthly based on the outstanding balance on the last calendar day of the month.
C. A trader can borrow 100% of a stock's purchase price.
D. A trader generally must maintain at least 30% equity in their margin account.
E. A and D
F. All of the above
Answer 6: E
Generally speaking, a trader can borrow only up to 50% of the purchase price of securities that can be bought on margin, and they must maintain a minimum of 30% of the margin account's total value as equity at all times. Investment losses that cause the balance to fall below this threshold may trigger a maintenance margin call. Interest on the outstanding balance accrues daily but is posted to the account on a monthly basis. "Margin can be a powerful tool for amplifying investment gains, but it's not without risk," Kevin says. "That's why it's wise to maintain a cash buffer above what's required."
" id="body_disclosure--media_disclosure--636131" >Generally speaking, a trader can borrow only up to 50% of the purchase price of securities that can be bought on margin, and they must maintain a minimum of 30% of the margin account's total value as equity at all times. Investment losses that cause the balance to fall below this threshold may trigger a maintenance margin call. Interest on the outstanding balance accrues daily but is posted to the account on a monthly basis. "Margin can be a powerful tool for amplifying investment gains, but it's not without risk," Kevin says. "That's why it's wise to maintain a cash buffer above what's required."
Learn more about the potential benefits and risks of margin trading.
Question 7
What does a stock's relative strength index (RSI) measure?
A. How many days it closes up versus down over a set period
B. How much its price typically moves over a set period, often 14 days
C. Its price volatility within a range of time
D. Whether it is potentially overbought or oversold based on recent price momentum
E. None of the above
Answer 7: D
- Read more on using RSI to identify potential trend reversals.
- Learn about bearish chart patterns.
The RSI tracks the strength of a stock's gains versus its losses over a certain number of trading days on a scale of 0 to 100. For most stocks, an RSI that exceeds 70 in that period may mean it's "overbought" and due for a near-term pullback, whereas an RSI that dips below 30 generally means it's "oversold" and could be poised for a near-term rebound. "Of course, stocks that are moving on strong momentum can continue to do so," says Nathan Peterson, director of derivatives research and strategy at the Schwab Center for Financial Research. "It's best to look for other technical confirmations in addition to RSI. For example, when the RSI is in overbought territory, traders might wait for a bearish reversal pattern to manifest on the chart."
- Read more on using RSI to identify potential trend reversals.
- Learn about bearish chart patterns.
Question 8
A trader opens a position at $50 a share with a price target of $60. When the stock reaches $60 a share, the trader sells 50% of their position and lets the rest of the position run. Which tactic is the trader employing?
A. Hedging
B. Pyramiding
C. Scaling out
D. Layering out
E. None of the above
Answer 8: C
Find more strategies for incorporating risk management into your trade plan.
" role="dialog" aria-label="Scaling out refers to the strategy of selling a portion of a position in order to spread exit prices over a range and reduce the pressure to pick the perfect price. If the price continues to rise, a trader benefits from still owning some shares; if it falls, they've already liquidated part of their position at a higher price. Scaling in, or buying stock positions in portions at different price intervals, is another popular strategy for managing trades. "Scaling is really for traders who tend to see things as glass half full," says Joe Mazzola, Schwab's head trading and derivatives strategist. "Those who are constantly battling FOMO probably won't see the benefit."
Find more strategies for incorporating risk management into your trade plan.
" id="body_disclosure--media_disclosure--636066" >Scaling out refers to the strategy of selling a portion of a position in order to spread exit prices over a range and reduce the pressure to pick the perfect price. If the price continues to rise, a trader benefits from still owning some shares; if it falls, they've already liquidated part of their position at a higher price. Scaling in, or buying stock positions in portions at different price intervals, is another popular strategy for managing trades. "Scaling is really for traders who tend to see things as glass half full," says Joe Mazzola, Schwab's head trading and derivatives strategist. "Those who are constantly battling FOMO probably won't see the benefit."
Find more strategies for incorporating risk management into your trade plan.
Question 9
To help assess a stock's prospects and evaluate it from a value perspective, traders examine its:
A. Estimated earnings per share (EPS) growth
B. Estimated revenue growth
C. Forward price-to-earnings (P/E) ratio
D. Trailing P/E ratio
E. All of the above
Answer 9: E
By weighing estimated EPS and revenue against both trailing and forward P/E ratios, traders can see whether a company is efficiently converting demand into corporate profit. Combining multiple metrics can tell a more complete story of a stock's theoretical value, helping traders decide whether its current price is justified by the company's financial performance.
Learn about using fundamental analysis to inform your trades.
Question 10
A stock's price breaches its 20-day simple moving average, suggesting a potential breakout. For a trader who wants to open a new position, which order type would attempt to lock in gains as the stock moves upward or help manage risk by trying to limit losses if the stock moves down?
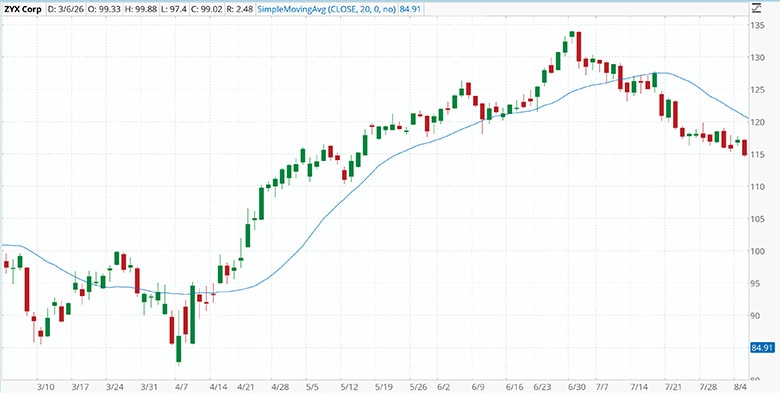
Source: thinkorswim® desktop platform for Mac. Screenshots are for illustrative purposes only, may be historical in nature, and should not be used as a basis for any investment decision.
A. Limit order
B. Profit target
C. Stop limit order
D. Trailing stop order
E. None of the above
Answer 10: D
Learn how to set trailing stop orders on the thinkorswim® desktop app.
" role="dialog" aria-label="Unlike a standard stop order, which uses a fixed dollar amount, a trailing stop follows the stock price at the desired distance or percentage a trader sets when placing the order, allowing them to participate in a breakout while also protecting some of their downside. If the stock suddenly reverses below the trail threshold, it triggers a sale and may help minimize losses. "Be aware, however, that trailing stops are vulnerable to price gaps," Kevin says. "They don't guarantee a specific execution price, just that they will execute if the stock price falls to or below the trigger price."
Learn how to set trailing stop orders on the thinkorswim® desktop app.
" id="body_disclosure--media_disclosure--636186" >Unlike a standard stop order, which uses a fixed dollar amount, a trailing stop follows the stock price at the desired distance or percentage a trader sets when placing the order, allowing them to participate in a breakout while also protecting some of their downside. If the stock suddenly reverses below the trail threshold, it triggers a sale and may help minimize losses. "Be aware, however, that trailing stops are vulnerable to price gaps," Kevin says. "They don't guarantee a specific execution price, just that they will execute if the stock price falls to or below the trigger price."
Learn how to set trailing stop orders on the thinkorswim® desktop app.
How'd you do?

0–3 correct | It might be time to brush up on the basics.
4–7 correct | Not bad, but there's room for improvement.
8–10 correct | Bravo! You're a well-informed trader.
Regardless of how you scored, there's always more to learn. Find more insights on foundational trading topics, complex strategies, and daily market news.
1Stefanos Bazinas, "The early bird gets the worm: A new normal in off-hours U.S. equities trading," nyse.com, 02/10/2025.
Discover more from Onward

Keep reading the latest issue online or view the print edition.