Fed Shifts to Hawkish Tune, But Keeps Rates Steady

In a widely expected decision, the Federal Reserve held rates steady at Wednesday's Federal Open Market Committee (FOMC) meeting, leaving its target range between 3.5% and 3.75%. However, the central bank adopted a hawkish tone in its post-meeting policy statement, noting it was committed to bringing down inflation. That followed dissents from three officials at the previous meeting over its "easing bias."
With inflation stuck above the Fed's 2% target rate, Chairman Kevin Warsh emphasized multiple times in his press conference that the central bank will be "unambiguous and unanimous" in its commitment to stabilizing consumer prices.
The three major market indexes closed down around 1% or more after the meeting as investors' expectations for rate hikes this year rose. Short-term yields also jumped, but long-term yields were mixed, reflecting the Fed's commitment to taming inflation. The U.S. Dollar Index rose 1% given the higher yields.
"The recent past need not be prologue," Warsh said in his press conference. "If we do our job, we can make strong growth, low prices, and strong employment mutually compatible. What you heard from the committee today is we've got some work to do on the price stability front."
Looking ahead
In its unusually brief 130-word policy statement, the FOMC highlighted elevated uncertainty due, in part, to the conflict in the Middle East, but also discussed positive economic developments more prominently, marking a shift from April. The length of the statement—and the exclusion of forward guidance—seems like it was a statement from Warsh, highlighting how he wants the Fed to communicate less to leave room for policy changes.
The Fed's so-called "dot plot" of economic projections showed nine members were projecting at least one hike in 2026, while eight others projected rates to remain unchanged. There was still one dot projecting a rate cut this year.
Notably, the rate projections included fewer than the typical 19 submissions as Chairman Kevin Warsh opted not to provide his forecast. The widely expected omission aligns with Warsh's longstanding skepticism of forward guidance.
The new Fed chair has argued that projections make it harder for committee members to pivot if economic circumstances change. Interestingly, there were only 17 dots provided for 2028, meaning that another Fed official opted not submit a projection for that year.
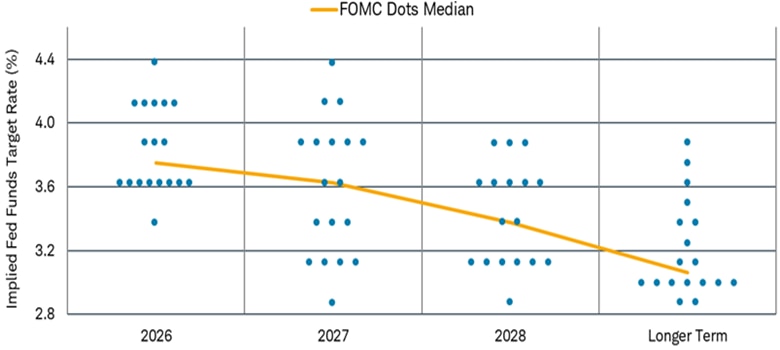
Source: Bloomberg. FOMC DOT Plot as of 6/17/2026.
The economic projections themselves painted a picture of an economy that will continue to expand, albeit at a slower pace than officials anticipated just a few months ago. Policymakers now expect real gross domestic product (GDP) growth of 2.2% in 2026—down slightly from March's projections.
On inflation, officials projected price pressures to prove more persistent than previously expected, with the Personal Consumption Expenditures (PCE) Price Index seen ending the year at 3.6% versus 2.7% in the Fed's prior forecast. Core PCE, which excludes more volatile food and energy prices, is anticipated to accelerate versus past projections as well, ending this year at 3.3% this year and 2027 at 2.5%.
Policymakers also revised their outlook for the labor market, forecasting an unemployment rate of 4.3% by year-end and 4.3% in 2027, compared with 4.4% and 4.3%, respectively, last time out.
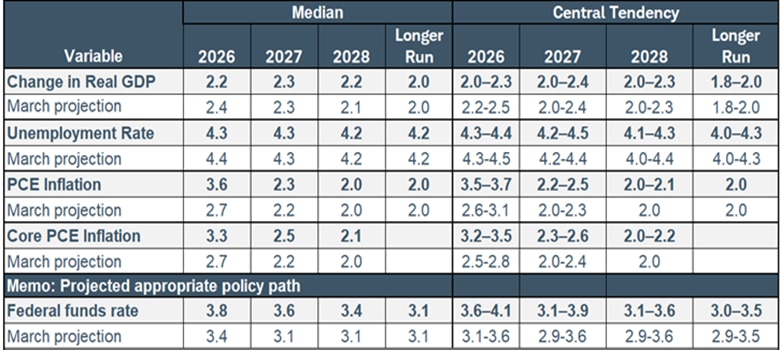
Source: Federal Reserve Board, 6/17/2026.
Notes: For each period, the median is the middle projection when the projections are arranged from lowest to highest. When the number of projections is even, the median is the average of the two middle projections. The central tendency excludes the three highest and three lowest projections for each variable in each year. The range for a variable in a given year includes all participants' projections, from lowest to highest, for that variable in that year. Longer Run projections for Core PCE are not collected.
Overall, the economic projections showed Fed officials expect the economy to remain resilient, but with slower growth and a softer labor market. However, inflation is expected to prove more stubborn than previously anticipated, meaning the risk of rate hikes this year have clearly risen.
Warsh takes the podium
For many investors, the most closely watched part of Wednesday's Fed meeting began after the decision itself, when Warsh took the podium for the first time as the Fed's 18th Chair of the Board of Governors. Throughout the press conference, Warsh repeatedly returned to the importance of price stability.
"The commitment we made was to deliver price stability; I expect us to live up to it," he said.
In his first major announcement as Fed Chair, Warsh also said that he will create five task forces to review key areas of Fed policy: communications, the balance sheet, reliance on existing data sources, productivity and jobs, as well as the inflation framework.
"Each task force will serve an objective shared by everyone in the system, shared by everyone around that table that I sat with over the last couple of days, a Federal Reserve that is clear-eyed about its mission, fit for purpose, and focused on the future," he said. No official changes have been made yet, but this is setting up the table for changes down the road.
As far as the inflation framework, Warsh explained that the Fed will review its 2% inflation target only once it's able to reduce inflation to that level. "That is the Federal Reserve’s long-held objective of 2%," he said. "The 'two' is the left of the decimal point. For now, 'zero' is to the right."
In response to a question of the level of restriction, Warsh acknowledged that there's a level of restrictiveness in the housing market, but "it's hard to use those same words anywhere else." Other Fed officials likely share that view given the number of dots projecting a hike by year-end.
Shifting Fed and Treasury expectations
Market expectations for rates shifted following the meeting, with the futures markets fully pricing in a rate hike in October, with the potential for another hike in December, according to Bloomberg. Prior to the meeting, there was an 85% implied probability of a hike by December.
The more hawkish tone raises the likelihood of a rate hike by the end of the year, and any discussion about rate cuts should be off the table for now. Warsh's "unambiguous and unanimous" comments, and the final line in the statement that said "the Committee will deliver price stability," suggest that a rate hike might be necessary for the Fed to reach their goal. With so much uncertainty around the outlook in the Middle East, the Fed may continue to take a wait-and-see approach over the short-run, but we acknowledge that the likelihood of a hike by year-end has increased.
Treasury yields rose across most the curve as investors digested the Fed's latest decision and more hawkish communications. The more policy-sensitive 2-year Treasury yield ended the day at 4.21%, a 15-basis point daily increase, while the benchmark 10-year Treasury yield sat at 4.49%.
While the outlook on rates remains very uncertain, particularly as oil prices come down, with nine dots projecting hikes, short-term Treasury yields may rise further over the near term. The 10-year yield may hold in the 4% to 4.5% range, but there are still more upside risks than downside risks.