Insights & Education
Keeping you at the forefront of modern investing
The latest commentary
Stocks Dip on GDP, PCE Reports


Washington: What to Watch Now

Weekly Stock Options

Muni Bonds: 3 Key Questions

Cascade: AI's Latest Phase
Investing Basics

Technical Analysis
What's new in trading
Weekly Stock Options


OTM and ITM Vertical Spreads

Covered-Call ETF: What to Know

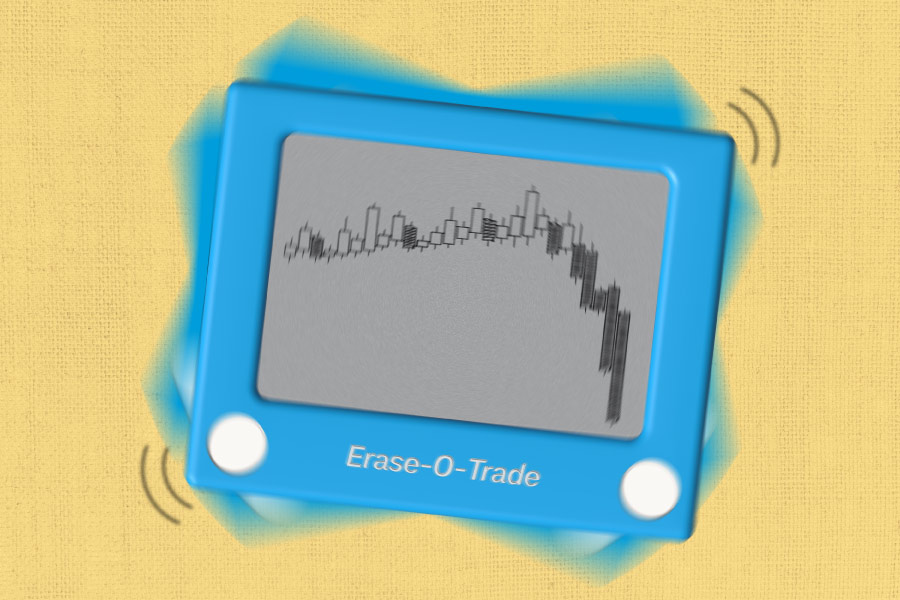
Recover From a Trading Loss

How to Scan for Stocks

Smart Margin Trading Explained
Planning and retirement
Investing in Your 20s


Money and Relationships

Dating and Money

529 Eligible Expenses

Life Insurance and Your Estate

401(k)—Scam or Smart Move?
Schwab original podcasts

Onward magazine

Insurance
Charitable Giving
Annuities
Insurance
Explore more topics
This material is intended for general informational and educational purposes only. This should not be considered an individualized recommendation or personalized investment advice. The securities, investment products and investment strategies mentioned are not suitable for everyone. Each investor needs to review an investment strategy for their own particular situation before making any investment or trading decisions.
All expressions of opinion are subject to change without notice in reaction to shifting market conditions. Data contained herein from third party providers is obtained from what are considered reliable sources. However, its accuracy, completeness or reliability cannot be guaranteed.
For illustrative purposes only. Individual situations will vary. Not intended to be reflective of results you can expect to achieve.
Investing involves risk, including loss of principal, and for some products and strategies, loss of more than your initial investment.
Past performance is no guarantee of future results.
Equity and index options carry a high level of risk and are not suitable for all investors. Certain requirements must be met to trade options through Schwab. Please read the Options Disclosure Document titled "Characteristics and Risks of Standardized Options" before considering any option transaction. Supporting documentation for any claims or statistical information is available upon request.
Hedging and protective strategies generally involve additional costs and do not assure a profit or guarantee against loss.
With long options, investors may lose 100% of funds invested.
Spread trading must be done in a margin account.
Multiple leg options strategies will involve multiple transaction costs.
Covered calls provide downside protection only to the extent of premiums received, and prevent any profitability above the strike price of the call.
Futures, and Futures options trading involves substantial risk and is not suitable for all investors. Please read the Risk Disclosure Statement for Futures and Options prior to trading futures products.
Forex trading involves leverage, carries a substantial level of risk, and is not suitable for all investors. Please read the Risk Disclosure for Forex: https://www.schwab.com/resource/forex-risk-disclosure-statement.
Futures and forex accounts are not protected by the Securities Investor Protection Corporation (SIPC). Forex accounts do not receive a preference in any bankruptcy proceeding pursuant to Part 190 of the CFTC's regulations.
Read additional CFTC and NFA futures and forex public disclosures for Charles Schwab Futures and Forex LLC.
Futures, futures options, and forex trading services provided by Charles Schwab Futures and Forex LLC. Trading privileges subject to review and approval. Not all clients will qualify. Forex accounts are not available to residents of Ohio or Arizona.
Charles Schwab Futures and Forex LLC., is a CFTC-registered Futures Commission Merchant and NFA Forex Dealer Member.
Charles Schwab Futures and Forex LLC (NFA Member) and Charles Schwab & Co., Inc. (Member SIPC) are separate but affiliated companies and subsidiaries of The Charles Schwab Corporation.