Scanning for Stocks with the Stock Hacker Tool

Knowing how to use a scanning tool is essential for traders who want to efficiently identify trading and investment opportunities. Thankfully, with help from the thinkorswim® Stock Hacker tool, it's possible to quickly scan for stocks that fit specific criteria.
Traders can sort stocks by industry, market capitalization, or exchange and even track personal watchlists, stocks with recent analyst upgrades or downgrades, or the most actively traded or volatile equities. The Stock Hacker tool isn't just for stocks, either. Traders can also scan for exchange-traded funds (ETFs), futures, and other investment products. Let's look at a few examples of the Stock Hacker tool in action and then walk through how to use it.
Stock Hacker examples
Starting on the Scan tab of the thinkorswim platform, a trader can access the Stock Hacker tool to easily sort through stocks or other investment products using dozens of category and analysis filters. For example, the image below shows a simple Stock Hacker scan that filtered for stocks with a market capitalization above $1 billion and a current dividend yield below 4%.
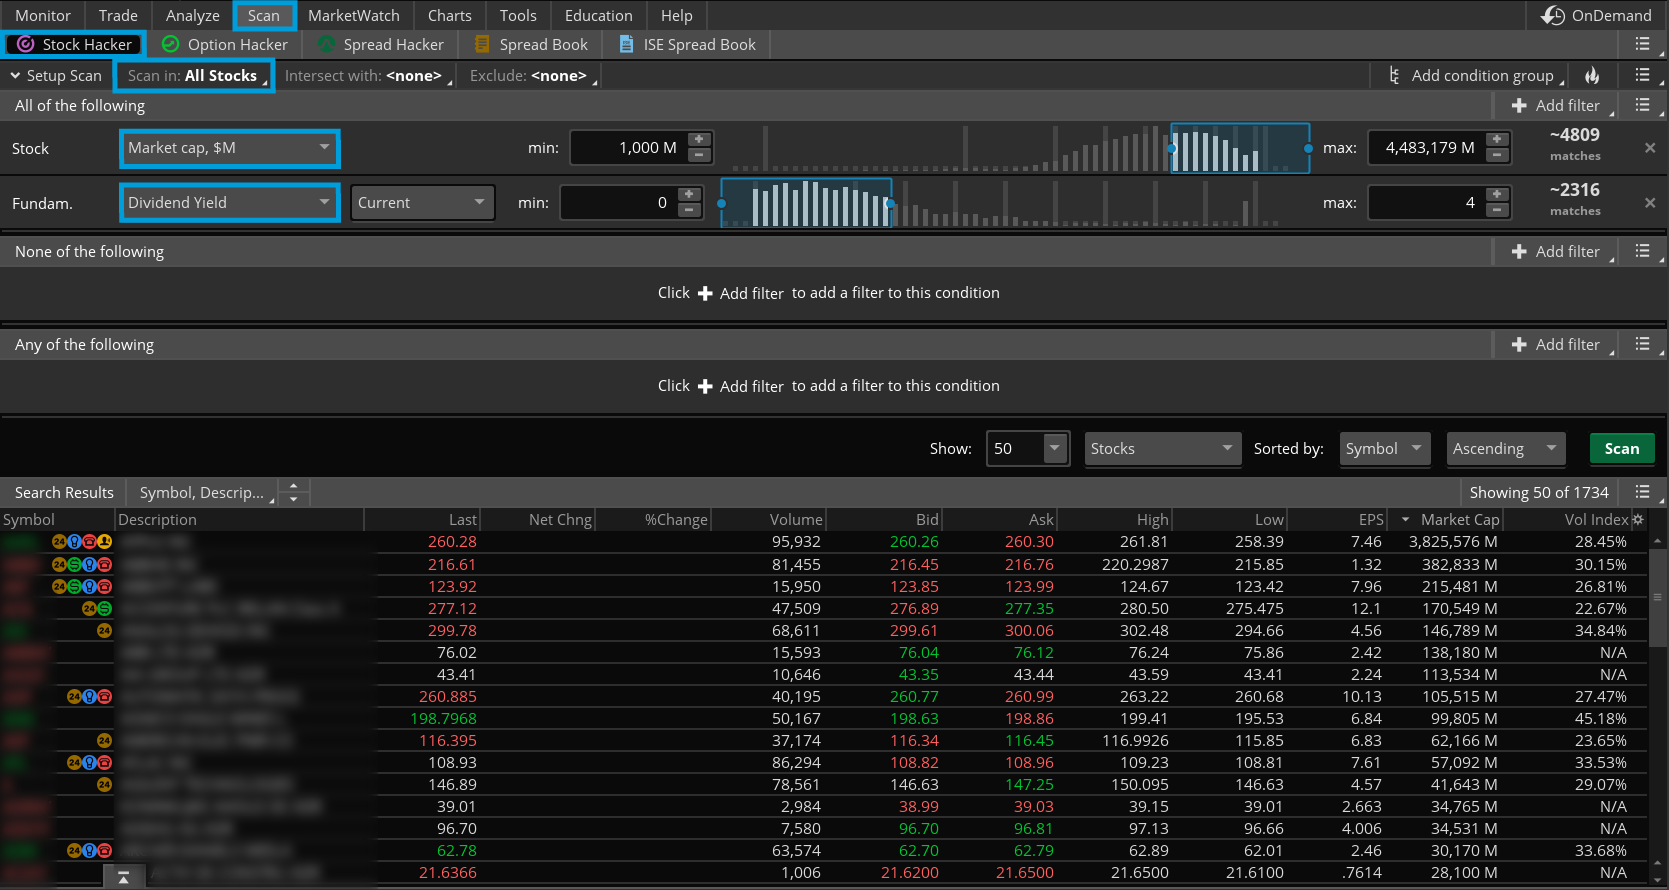
Source: thinkorswim platform
For illustrative purposes only.
For option traders, there's also the Option Hacker tool. It has a similar interface to the Stock Hacker and allows traders to perform scans for options contracts with specific characteristics. Traders can filter through various categories of optionable securities based on traits like days to expiration, implied volatility, trading volume, and more. For example, the image below shows an Option Hacker scan that filtered for biotechnology stock options with between 30 and 90 days left until expiration, an implied volatility between 15% and 50%, and a daily volume of between 12 and 40 traded contracts.
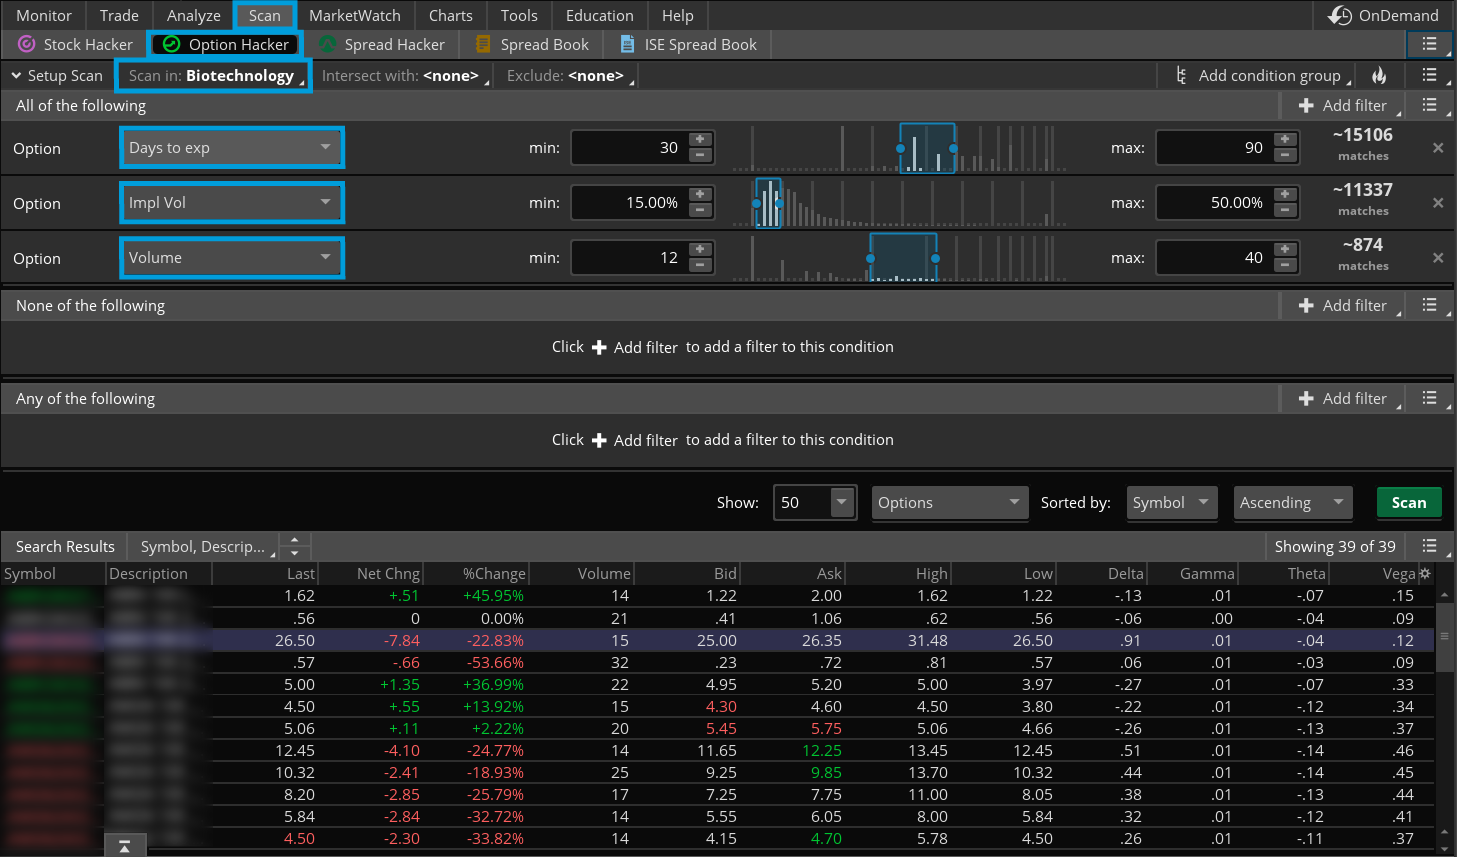
Source: thinkorswim platform
For illustrative purposes only.
How to use the Stock Hacker tool
Let's dive into a specific, step-by-step example of how to use the Stock Hacker scanning tool:
1. Select the Scan tab and then select Stock Hacker (top left corner).
2. To scan through a subset of stocks, select the Scan in: drop-down menu. This menu defaults to All Stocks. However, traders can also select from a wide range of predefined categories, enabling them to screen various types of securities based on dozens of unique criteria.
3. To find stocks with listed options, for example, select Category—the first item on the Scan in menu—and then select All Optionable.

Source: thinkorswim platform
For illustrative purposes only.
Narrowing the selection and adding studies
Now, let's take the Stock Hacker scan example one step further by adding criteria filters and studies to narrow the selection.
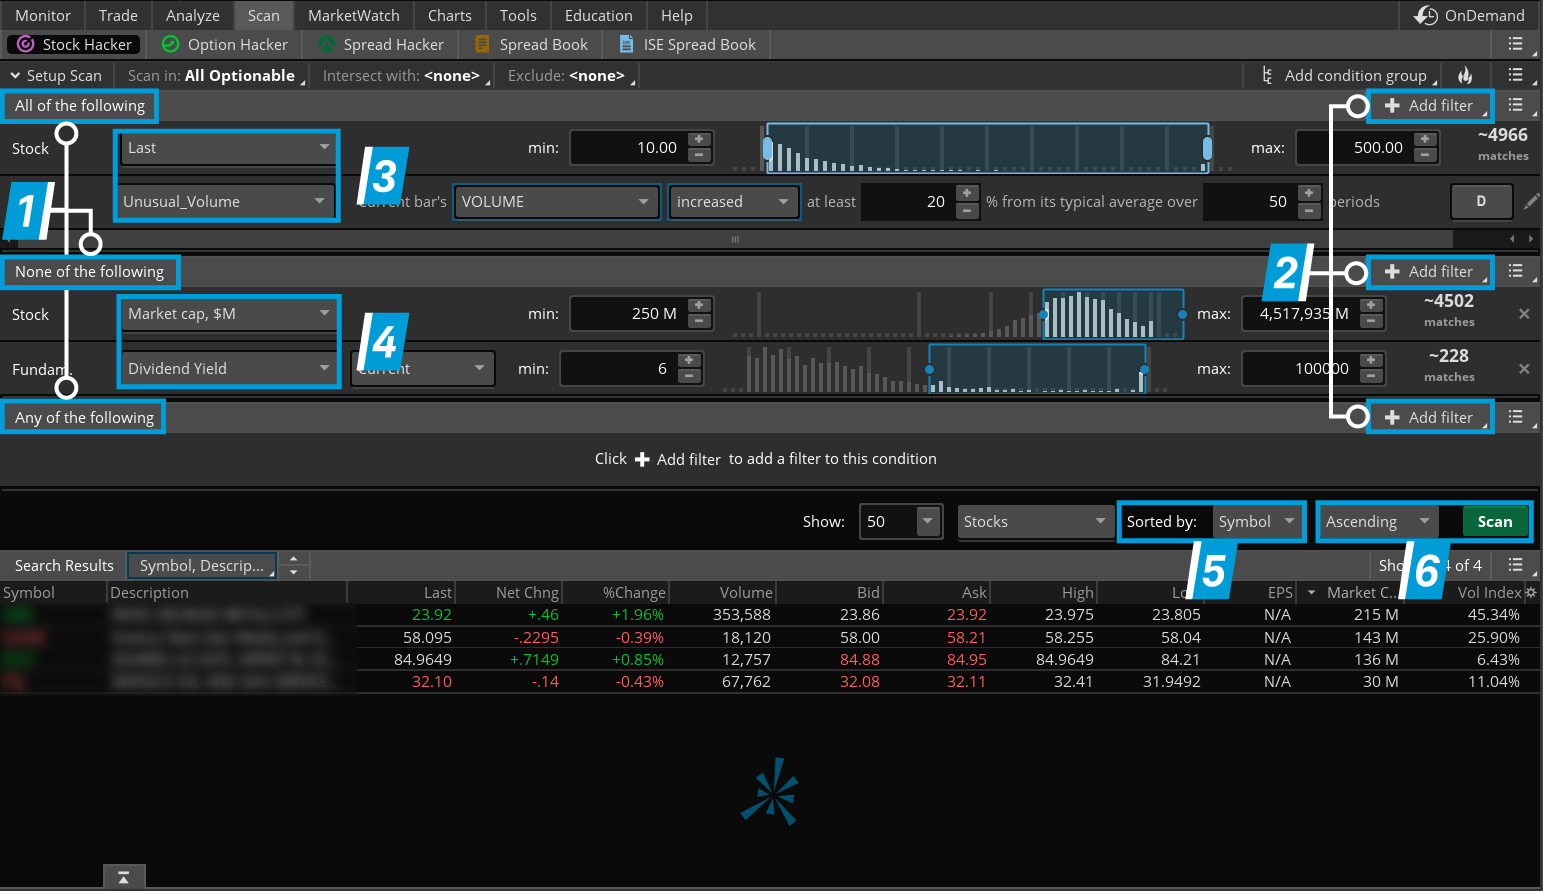
1. Condition groups allow traders to add extra search filters and should already appear below the Setup Scan row. If a trader wants to add more condition groups, they can select Add condition group (far right of the Setup Scan row), then select either All of the following, None of the following, or Any of the following.
2. Next, from the +Add filter button, select the filter type from the drop-down menu for any or all the above three condition groups. For example, consider adding two filters for the All of the following category and two filters for the None of the following category.
3. For the first All of the following category filter, select Stock from the +Add filter drop-down menu. Then select Last from the Stock drop-down menu and enter a minimum price and a maximum price. This will produce stocks trading within a specific, desired price range. Then consider adding a Study filter. For this example, the scan is filtered for unusual trading volume. This will search for stocks that have experienced unusually high or low volume compared to their average volume over a specified period. To do this, select Study from the +Add filter drop-down menu and then Unusual_Volume from the Study drop-down menu. The default inputs for this filter will search for stocks with volume at least 20% above the typical average over the past 50 periods. However, these inputs can easily be adjusted as desired via their respective drop-down menus.
4. To add None of the following category filters, traders can follow the same process as discussed in step three. These filters will scan for stocks that do not meet the criteria selected. One way to start is by adding a Stock filter from the +Add filter drop-down menu. Then select Market Cap, $M and enter a minimum and maximum value. This will exclude stocks with certain market caps. Next, add a Fundamental filter from the +Add filter drop-down menu. Then select Dividend Yield and enter a minimum and maximum value. This will exclude stocks with specific dividend yields.
5. In the Sorted by drop-down menu above the search results, there are several choices for how to sort the scan's final results. The default is to sort by Symbol.
6. In the next drop-down menu to the right, select Ascending, then Scan.
Source: thinkorswim platform
For illustrative purposes only.
The results from the Stock Hacker scan will appear at the bottom of the screen. Traders can edit the filters as needed until a list matches the desired criteria. Note: If All Optionable securities is selected, both stocks and ETFs with listed options will be included in the scan.
In the example scan above, we first created a list of securities with tradable options. Then, we screened these securities to ensure they're trading within a specific price range and have experienced a significant increase in volume. And finally, we excluded securities that have market caps above $250 million or high dividend yields.
How to chart scan results
After scanning for a list of stocks that meet the desired criteria, traders can learn more about each stock by selecting any symbol in the scan results, right-clicking the stock, and selecting More info on […]. To quickly create a chart, select TOS Charts from the More info on […] drop-down menu.
Then, by adding chart studies and making some minor adjustments to the parameters, it's possible to analyze a stock. Three studies likely to help a beginner trader include:
- Simple moving average. A technical indicator that's calculated by adding the closing prices of a security over a specific period and then dividing that sum by a set number of trading days.
- Volume. A key indicator of market activity, liquidity, and the strength of price movements that is found by adding the total number of shares or options contracts traded during a specific period.
- Relative Strength Index (RSI). A technical analysis tool that measures current and historical strength or weakness in a stock based on closing prices for a recent trading period. The RSI is plotted on a vertical scale from 0 to 100. A reading above 70 is considered overbought, while an RSI below 30 is considered oversold.
When adding these studies, it's important to note that the time frame for thinkorswim charts defaults to a one-year daily chart (1Y:1D). To adjust, select the time frame drop-down labeled D above the right side of the chart, then select Time frame and enter the preferred time frame.
1. From the Studies menu (upper-right top row), add a 50-day SimpleMovingAvg by following this sequence:
- Select Studies > Add study > Moving Averages > SimpleMovingAvg.
- Next, change the parameters to 50 by right-clicking the SimpleMovingAvg line itself.
- Select Edit study SimpleMovingAvg.
- In the parameters window, change the length to 50.
2. Volume is a default indicator, so there's no need to add it. However, if the volume indicator isn't displayed, it's possible to add it within the Settings menu.
3. To add the RSI, select Studies > Add study > Momentum Studies > M-S > RSI. The example chart below contains all three of these studies.
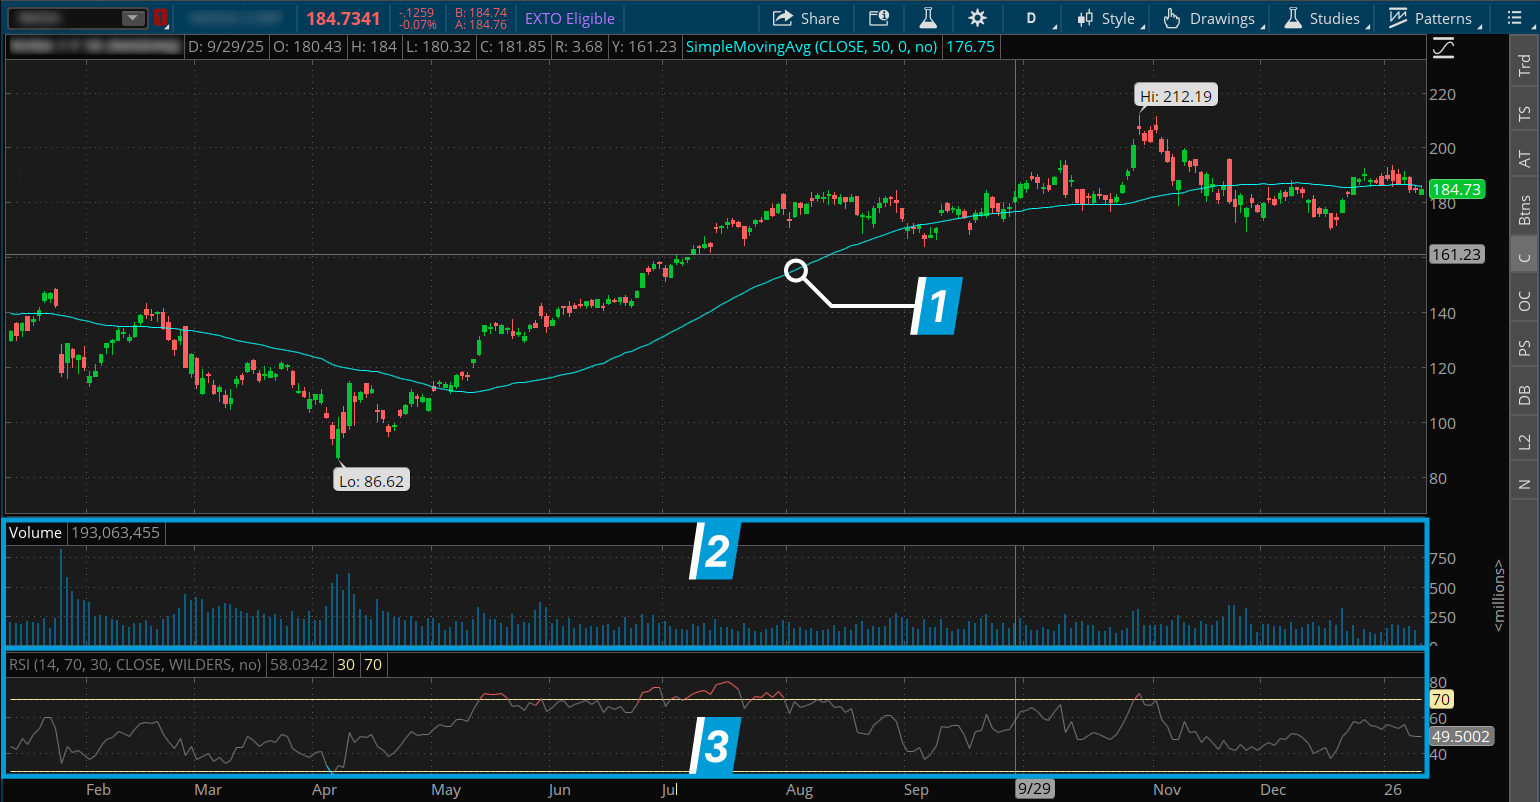
Source: thinkorswim platform
For illustrative purposes only.
Using technical analysis and a thinkorswim stock chart like the one above, traders may potentially spot trends, time entry or exit points, or assess risk. Charts and studies provide visual data that complements fundamental stock analysis, and this combination can be very useful for short-term traders or even longer-term investors. Just remember, past performance is no guarantee of future results, and no one can be certain that any trend will continue in the future.
Bottom line
Scanning tools can be a powerful way to find new investment or trading ideas and then quickly analyze them using technical analysis and charting. For example, long-term investors can easily look for dividend stocks with strong balance sheets or find potentially undervalued growth stocks. Traders, meanwhile, can search for stocks that are trading above their 50-day moving average or those with unusually high volume.
There's no guarantee the stocks found using scanners will perform exactly as expected, but with thousands of stocks to search through, these are critical, time-saving tools that are well worth making the effort to master.
Want to learn more about using the Stock Hacker tool? Watch Schwab's in-depth video on how to use the Stock Hacker to find stocks for bullish trading strategies.