Should You Consider High-Yield Municipal Bonds?

High-yield municipal bonds are one of the worst performing asset classes this year but generally offer higher yields than investment grade munis. For investors that are in higher tax brackets and are comfortable taking on the added risks, they may be wondering, "Do they deserve a place in my portfolio?"
We believe high-yield munis are an asset class that carries additional risks, but a small allocation may be appropriate for some investors. The caveat is that the entry point now isn't that attractive. Valuations are low and if the economy begins to falter, returns for high yield munis will likely suffer more than investment-grade munis.
High-yield munis are the worst-performing fixed income asset classes YTD
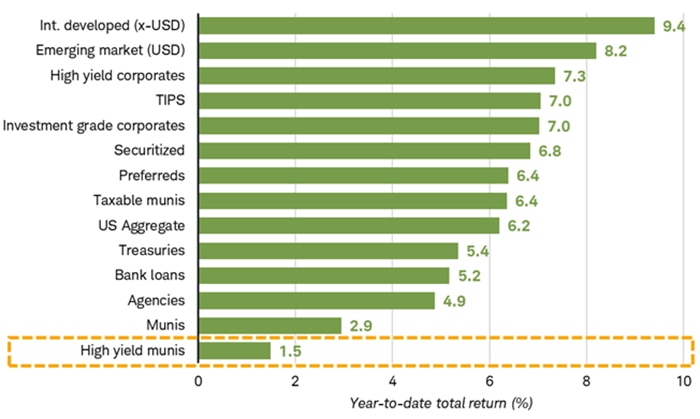
Source: Bloomberg, as of 9/19/2025.
See Important Disclosures for a list of indices used. Past performance is no guarantee of future results. Indexes are unmanaged, do not incur management fees, costs and expenses and cannot be invested in directly.
A primer on high-yield munis
High-yield municipal bonds are like other municipal bonds in that they're issued by municipalities and their interest payments are generally exempt from federal and potentially state and local income taxes. But that's where most of the similarities end, in our view. High-yield munis differ from investment-grade municipal bonds because they have credit ratings that are below investment-grade, or have no credit rating at all.
Lower credit ratings mean high-yield bond issuers are considered more vulnerable to missing interest payments or even failing to repay principal. In exchange for the increased risks, yields for high-yield munis are usually greater than yields for investment-grade munis. For example, the yield to worst for the Bloomberg Municipal Bond High Yield Index, which is a broad index of high-yield munis, is 5.6%, compared with 3.7% for the Bloomberg Municipal Bond Index, which is a broad index of investment-grade munis.1
Before deciding whether to invest in the high yield muni market, here are some points that we believe investors should be aware of:
1. Yields for high-yield munis aren't that attractive, in our view. Yields for many major fixed income asset classes have risen substantially from their lows in 2021 and despite recently pulling back, are near the highest they've been in the past decade, but that's not the case with high-yield munis. Yes, the yield for the broad index has increased from near 3% in 2021 to 5.6% today, but that's only slightly more than the average yield over the past decade. The same can't be said for many other fixed income investments.
Yields for high-yield munis are only slightly above their longer-term averages
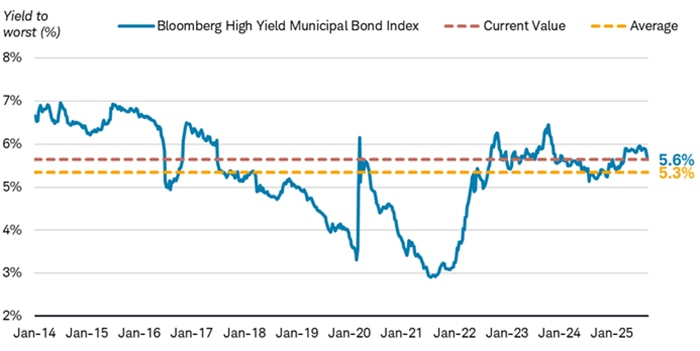
Source Bloomberg High Yield Municipal Bond Index, as of 9/22/2025 using weekly data. Average is from 1/13/2014 to 9/22/2025.
Yield to worst is a measure of the lowest possible yield that can be received on a bond with an early retirement provision. Past performance is no guarantee of future results. Indexes are unmanaged, do not incur management fees, costs and expenses and cannot be invested in directly.
While a tax-advantaged yield of 5.6% may seem attractive, we don't think it is relative to investment-grade munis. As shown in the chart below, the difference between yields for the Bloomberg Municipal Bond Index and the Bloomberg High Yield Municipal Bond Index is close to the lowest level in a decade. In other words, the extra yield that high-yield muni investors are receiving for taking on the extra risk isn't that great, in our view.
The extra yield that high yield munis generally offer compared to investment-grade munis is near the lowest level over the past decade
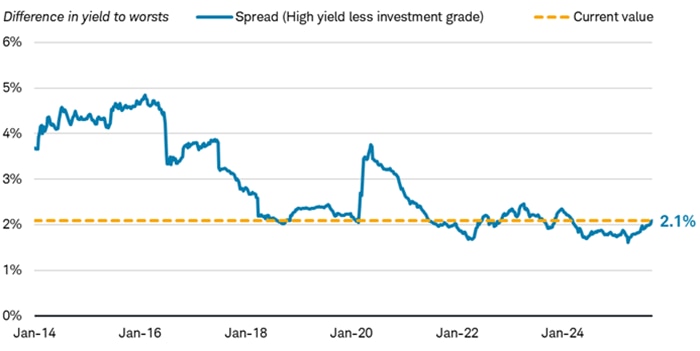
Source: Difference in yield to worst between the Bloomberg High Yield Municipal Bond Index and the Bloomberg Municipal Bond Index, using weekly data from 1/13/2014 to 9/22/2025.
The difference in yields may be attributable to other factors such as maturity, durations, coupons, call features, among others. Past performance is no guarantee of future results. Indexes are unmanaged, do not incur management fees, costs and expenses and cannot be invested in directly.
Additionally, a reason why the index of high-yield munis has a higher yield is because it also has a longer duration. Duration is a measure of interest-rate sensitivity and prices for bonds with longer durations are generally more volatile if interest rates fluctuate. As a result of the increased risk, bonds with longer durations generally yield more than bonds with shorter durations. One method to isolate the yield regardless of duration is to look at the yield per unit of duration. This is a simple ratio of the index's yield to worst divided by its duration. It is essentially a measure of reward, yield, per unit of risk, and duration. Theoretically, bonds with greater credit risks should offer higher yields after stripping away the impact of duration, but that isn't the case with high-yield munis. For example, high yield corporate bonds, which have a large amount of credit risk, have the highest yield per unit of duration. The yield per unit of duration is lower for high-yield munis than it is for investment-grade munis. This means that when factoring in duration risk, investors are getting a lower yield with high-yield munis even though they have greater credit risk.
After considering the impact of duration, yields for high-yield munis are low
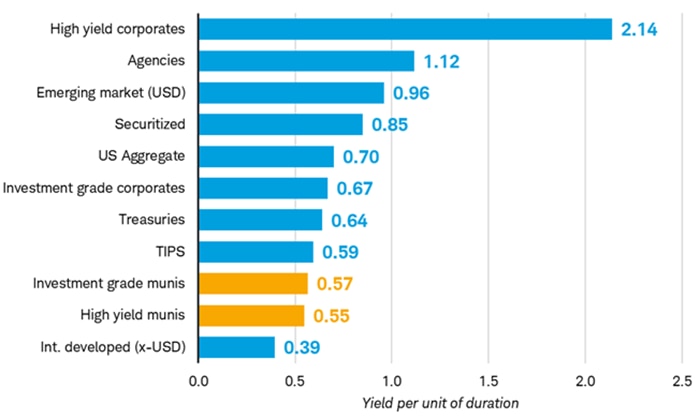
Source: Bloomberg. See disclosures for a list of indices. As of 9/15/2025.
The yield per unit of duration is a simple ratio of the index's yield to worst divided by its duration. Indexes are unmanaged, do not incur management fees, costs, and expenses and cannot be invested in directly. Past performance is no guarantee of future results.
The caveat is that some high-yield mutual funds and exchange-traded funds (ETFs) track different benchmarks and therefore may have a shorter duration. This can result in a different yield per unit of duration ratio than what is shown above.
2. High-yield munis are very different from investment-grade munis. In general, the high-yield muni market is made up of issuers that function with a greater degree of operational risk compared to issuers in the investment-grade muni market. For example, as of September 19th, 2025, nearly 40% of the Bloomberg Municipal High-Yield index is made up bonds issued by economic- and industrial-development issuers, nursing homes, or medical facilities. These issues often have volatile revenue streams and may be based on speculative projects. They are not often what many consider a "traditional" municipal bond, such as a state, local government, or utility district.
We like to say that there's a difference between "municipal bonds" and "tax-exempt bonds." The two phrases are often used interchangeably, sometimes rightly so. However, while high-yield munis pay tax-exempt interest and have the word "municipal" in their name, we wouldn't consider them "municipal" bonds in the traditional sense. To illustrate, an example of a high-yield municipal bond is an issuer that has sold unrated muni bonds to finance plants that would turn vegetable waste into paper products. The risk profile of this type of issuer compared to that of the average city, state, or essential services revenue bond is vastly different in our view.
Although muni defaults historically are rare, when they happen, they've most often been in the high-yield portion of the muni market. This is due partly to their greater operational risks. Of all the munis that are currently in default, roughly 85% were initially unrated.2 Unrated bonds make up approximately two-thirds of the high yield universe.3
3. High-yield munis lack some of the diversification benefits of investment-grade munis. Additionally, high-yield munis have not provided the same diversification benefits that investment-grade municipal bonds have. As illustrated in the chart below, high-yield munis tend to have a higher correlation to equities than investment-grade munis do. Correlation is a measure of how closely returns move with one another. A correlation closer to 1 means that returns for the two assets move closely together and do not provide the diversification benefits when added to a portfolio, whereas the opposite is true for a correlation of negative 1. This means that in instances where equities are falling, high-yield municipal bonds have not provided the same level of diversification as investment grade municipal bonds.
This means that investors looking for stability during times when riskier investments, like stocks, are falling may be disappointed with high yield munis.
High-yield munis are more correlated with stocks than investment-grade munis
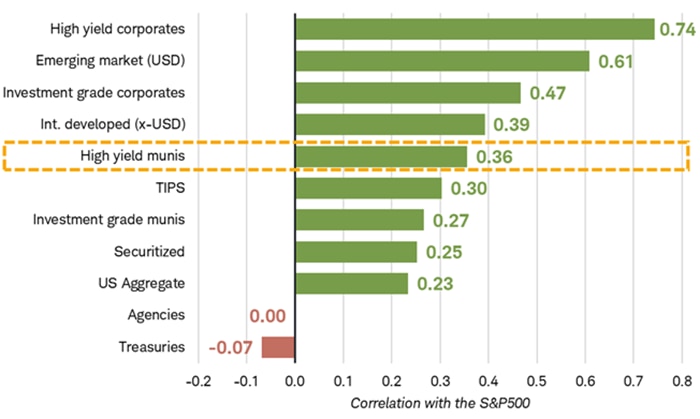
Source: Bloomberg, as of 8/29/2025 using monthly data. Correlations are from 12/31/2003 to 8/29/2025.
See Important Disclosures for a list of indexes used. Indexes are unmanaged, do not incur management fees, costs, and expenses and cannot be invested in directly. Past performance is no guarantee of future results.
4. High-yield munis can make sense relative to high-yield corporate bonds but only for high-net-worth investors. It's a slightly different story when comparing high-yield munis to high-yield corporates–but only for investors in a higher tax bracket. Since December 2015, a broad index of intermediate-term high-yield corporate bonds has yielded about 140 basis points more than a broad index of intermediate-term high-yield munis, on average (a basis point is one one-hundredth of a percentage point, or 0.01%). The difference in yields fluctuates, but more often than not, high-yield corporate bonds yield more than high-yield munis because of their lack of tax benefits. Today, the difference in yields is about 2.2% which is slightly above the longer-term average. In other words, high-yield munis are not overly attractive at these levels, but also not overly unattractive, in our view.
Spreads for high-yield munis relative to high-yield corporates are near their longer-term averages
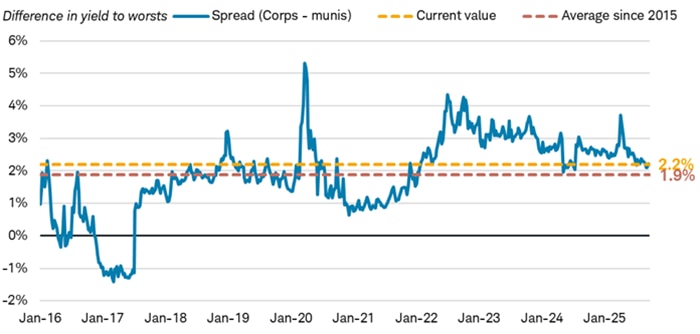
Source: Difference in yield to worsts between the 5-year portion of the Bloomberg High Yield Municipal Bond Index and the intermediate portion of the Bloomberg High Yield Corporate Bond Index, using weekly data from 1/2/2016 to 9/20/2025.
The difference in yields may be attributable to other factors such as maturity, durations, coupons, call features, among others. Indexes are unmanaged, do not incur management fees, costs, and expenses and cannot be invested in directly. Past performance is no guarantee of future results. Indexes are unmanaged, do not incur management fees, costs and expenses and cannot be invested in directly.
After considering taxes, high-yield munis look more attractive for investors in higher tax brackets. For investors in the 32% and above brackets, high-yield munis currently yield more than high-yield corporate bonds after taxes.
High-yield munis may yield more after taxes for some investors
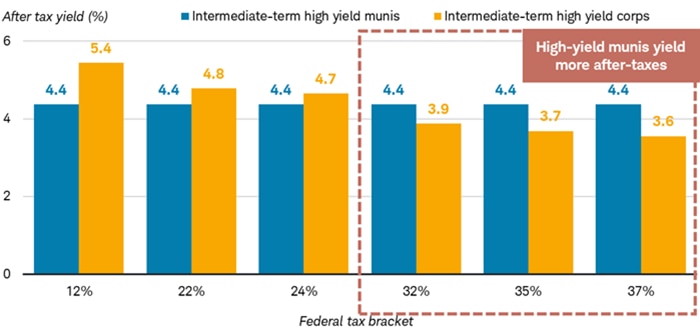
Source: Yield to worst for the 5-year portion of the Bloomberg High Yield Municipal Bond Index and the intermediate portion of the Bloomberg High Yield Corporate Bond Index, as of 9/20/25.
All tax brackets assume an additional 5% state income tax; the 35% and 37% brackets also assume an additional 3.8% Net Investment Income Tax. (NIIT). Past performance is no guarantee of future results. Indexes are unmanaged, do not incur management fees, costs and expenses and cannot be invested in directly.
In addition to potentially higher after-tax yields relative to high-yield corporate bonds, high-yield muni issuers historically have made timely interest and principal payments more frequently than have issuers of high-yield corporate bonds with similar credit ratings. Over a five-year period, 11.6% of munis rated B by Moody's defaulted, compared with 19.8% of corporates rated B by Moody's.4
It's important to note that these figures likely understate the amount of defaults because the study only includes bonds rated by Moody's. That's important because roughly two-thirds of the bonds in the Bloomberg Municipal High Yield Bond Index contain bonds that are not rated by Moody's. In fact, according to a Federal Reserve Bank of New York study from 2012, which is the latest data available, if all munis were included as part of the default study, not just bonds rated by Moody's, the number of defaults would be 36 times more than what Moody's reported.5 Although there is no more recent data available, we cite this study because it provides insight into one of the many factors to keep in mind when assessing high-yield muni bond default risk—the data is old but the point is still valid.
High-yield munis have tended to default less often than high-yield corporate bonds
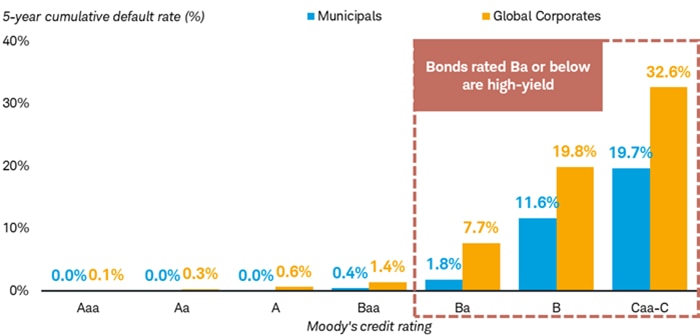
Source: Moody's Investors Services, as of 9/19/2025.
Past performance is no guarantee of future results.
The longer-term risk and reward characteristics of high-yield munis also look favorable compared to high-yield corporates. For example, over roughly the past decade, the average annual return before taxes for an index of high-yield munis is about 4.7% vs. 6.6% for an index of high-yield corporate bonds. However, returns for high-yield corporate bonds would be lower after considering the impact of taxes. Additionally, the standard deviation, which is a measure of risk, is lower for high-yield munis versus high-yield corporates. Securities with a higher standard deviation are more volatile than those with a lower standard deviation. In other words, after considering taxes, high-yield munis have historically had similar returns as high-yield corporate bonds but with less volatility.
High-yield munis have historically been less volatile but also have lower returns before taxes compared to high-yield corporate bonds
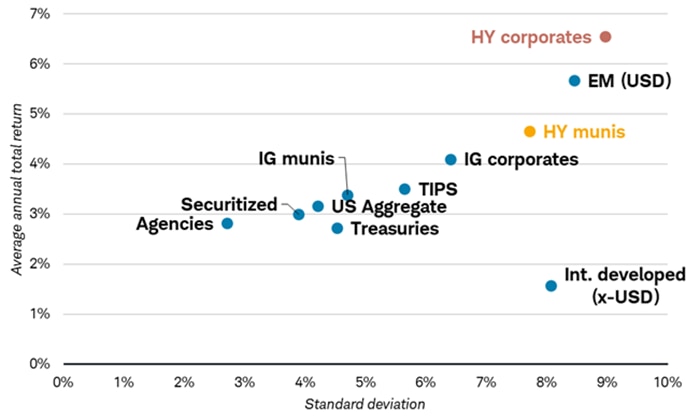
Source: Bloomberg. Monthly data from 12/31/2004 to 8/29/2025.
See Important Disclosures for a list of indices used. Past performance is no guarantee of future results. Indexes are unmanaged, do not incur management fees, costs and expenses and cannot be invested in directly. Note: "EM" is short for "emerging market," "HY" is short for "high yield," and "IG" is short for "investment grade."
Although high-yield munis offer some benefits, they do carry additional risks. One such risk is the size of the high-yield muni market. In the bond market, the size of the market matters because unlike stocks or ETFs, bonds don't trade on an exchange. This can pose a challenge for investors in parts of the bond market because nobody is required to execute a trade when you want or at a price you may reasonably expect.
Lower liquidity can affect bond funds and ETFs that hold high-yield munis. If it's difficult to trade the underlying investment, the fund may have to revalue the bond at a lower price. As a result, the funds that hold less-liquid bonds could see their net asset value drop more precipitously in a down market.
The high-yield muni market is a fraction of the size of other fixed income markets
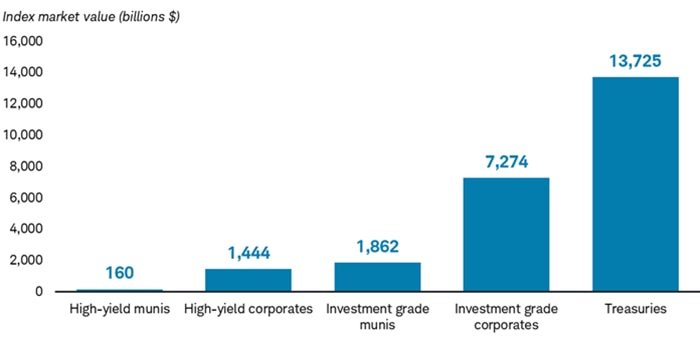
Source: Bloomberg, as of 9/16/2025.
High-yield munis = Bloomberg Muni High Yield Index; high-yield corporates = Bloomberg US Corporate High Yield Index; investment grade munis = Bloomberg Municipal Bond Index; investment grade corporates = Bloomberg US Corporate Index; and Treasuries = Bloomberg US Treasury Index.
What to consider now
If you do choose to invest in high-yield munis, we strongly suggest you consider investing with a professionally managed solution, such as a mutual fund, ETF, or separately managed account. Due to the combination of unique risks that high-yield munis exhibit, a professional manager can help with diversification and ongoing credit monitoring. However, using a professionally managed solution doesn't eliminate all of the risks associated with high-yield munis. Before investing in any fund, you should consult the fund's prospectus to understand its investment objectives, risks, charges, and expenses. Schwab clients can log in and research a list of pre-screened mutual funds and ETFs by accessing the Schwab Select Lists.
1 Source: Bloomberg, as of 9/15/2025.
2 Source: Municipal Market Analytics, as of 9/4/2025. Based on number of bonds.
3 Source: Based on the composition of the Bloomberg High Yield Municipal Bond Index, as of 9/15/2025.
4 The Moody's investment grade rating scale is Aaa, Aa, A, and Baa, and the sub-investment grade scale is Ba, B, Caa, Ca, and C. Standard and Poor's investment grade rating scale is AAA, AA, A, and BBB and the sub-investment-grade scale is BB, B, CCC, CC, and C. Ratings from AA to CCC may be modified by the addition of a plus (+) or minus (-) sign to show relative standing within the major rating categories. Fitch's investment-grade rating scale is AAA, AA, A, and BBB and the sub-investment-grade scale is BB, B, CCC, CC, and C.
5 Appleson, J., Parsons, E., and Haughwout, A.F., "The Untold Story of Municipal Bond Defaults," Liberty Street Economics, Federal Reserve Bank of New York, August 15, 2012.