Technical Analysis Weekly

- Market
- Support
- Resistance
- Technical View
-
MarketS&P 500SupportSummer lows + 200-day Simple Moving Average (SMA) ~7,340ResistancePolarity ~7,600Technical ViewBearish
-
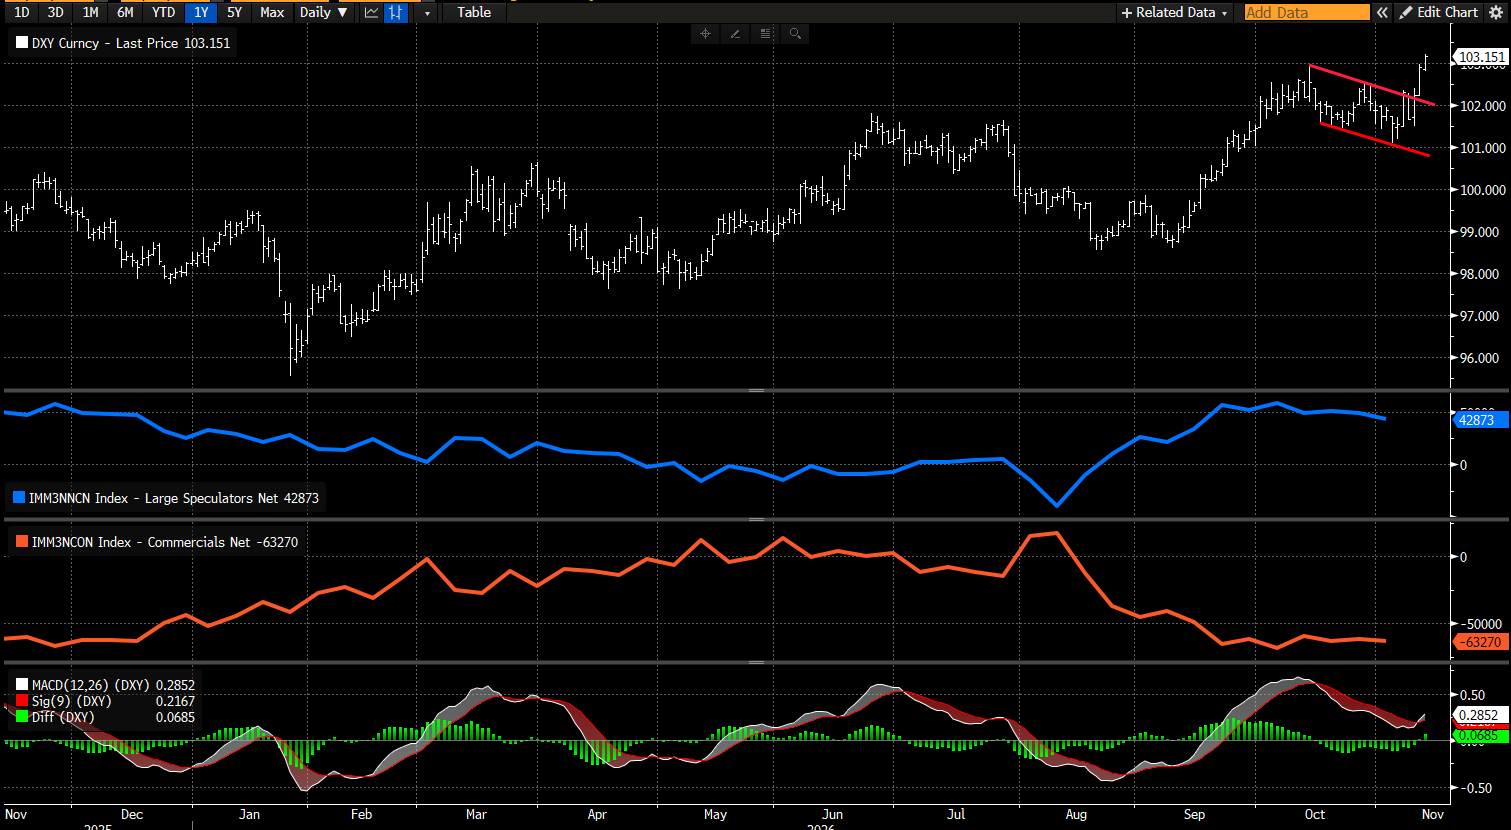
MarketUS Dollar IndexSupport102Resistance103.35Technical ViewNeutral
-
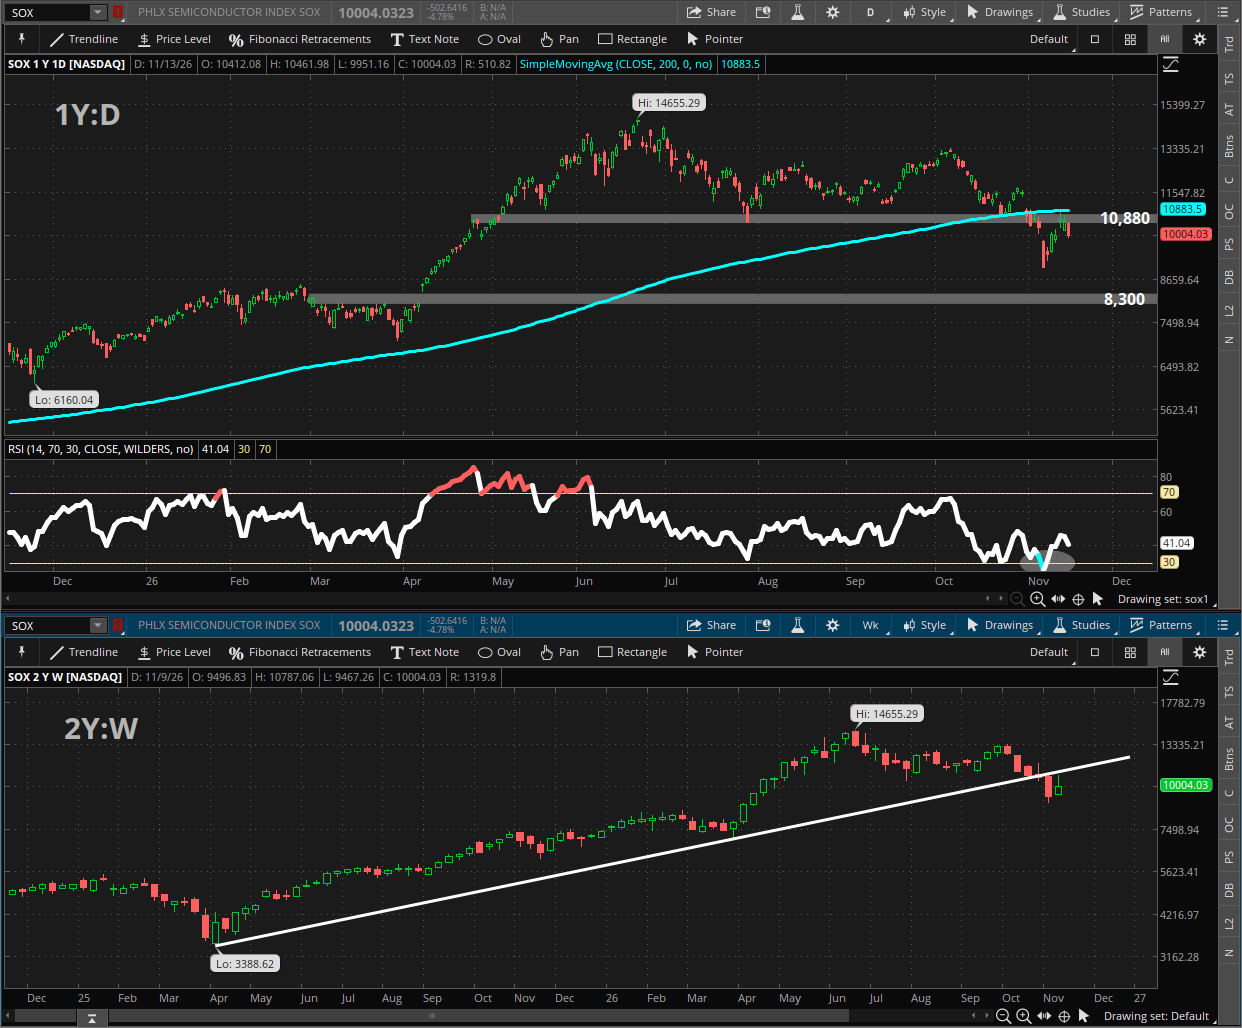
MarketSemiconductorsSupportApril gap ~8,300Resistance200-day SMA ~10,880Technical ViewBeraish
-
MarketRussell 2000SupportNeckline support ~2,720Resistance200-day SMA ~2,810Technical ViewBearish
-
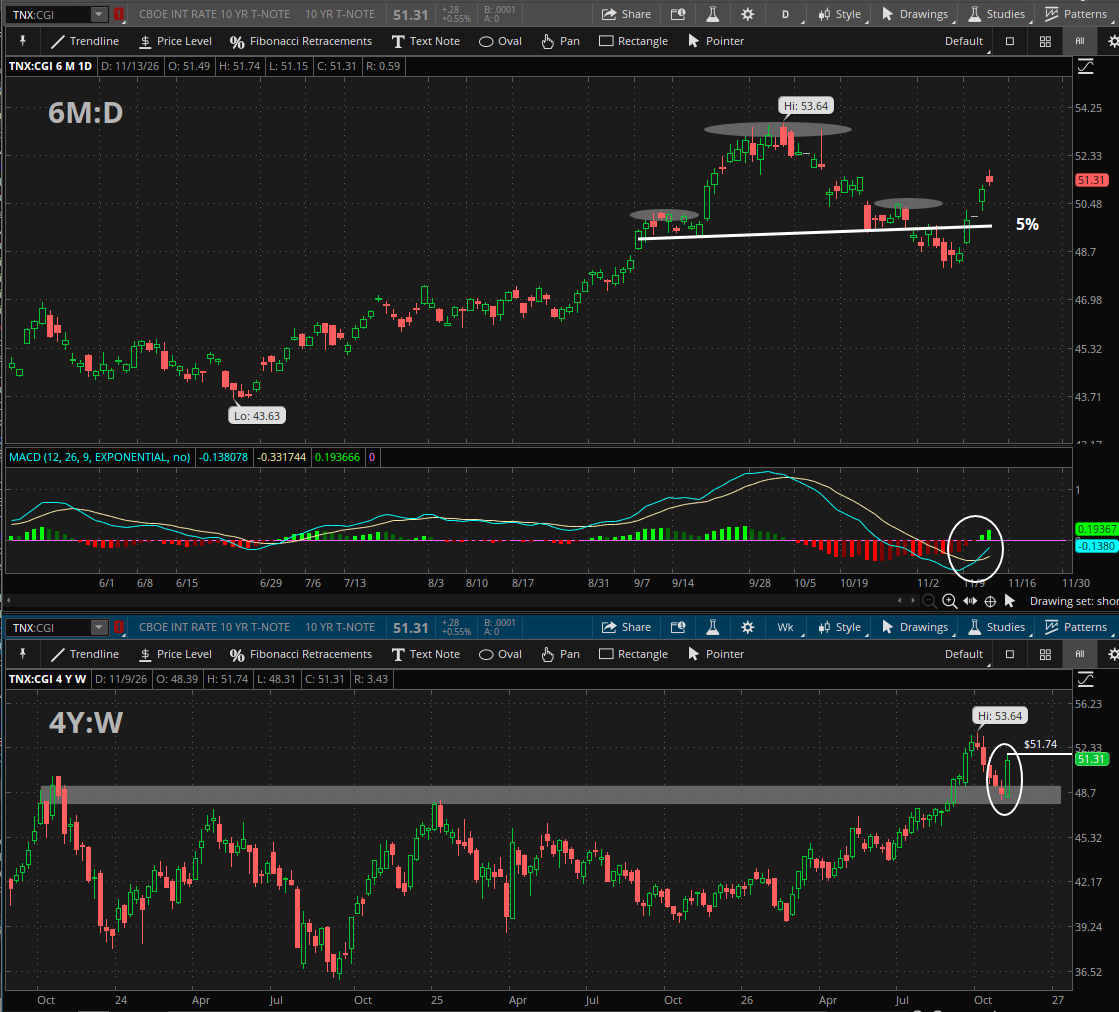
Market10-Year Treasury YieldsSupportFormer neckline ~5%ResistanceYearly highs ~5.36%Technical ViewBullish
-
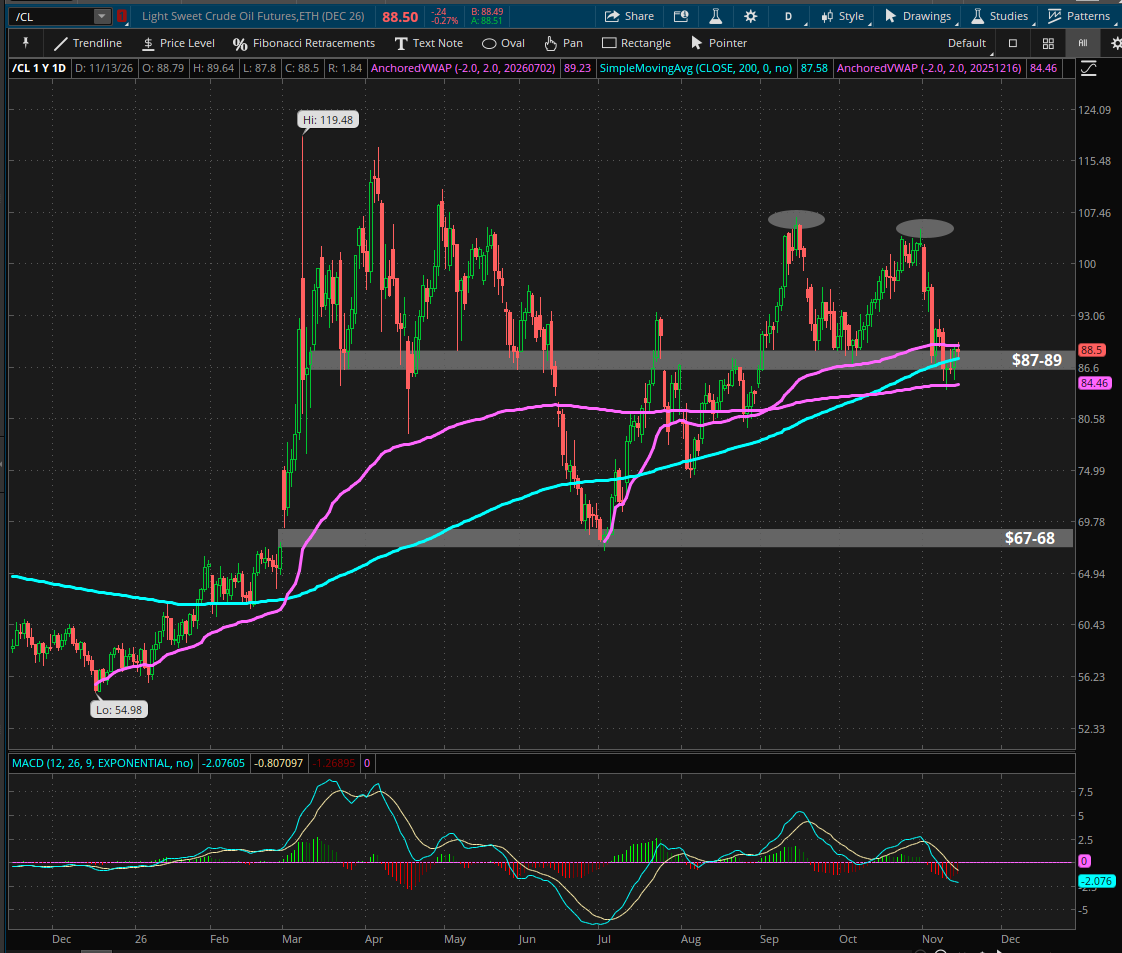
MarketCrude OilSupportMeasured objective ~$67-68ResistanceConfluence ~$87-89Technical ViewNeutral
-
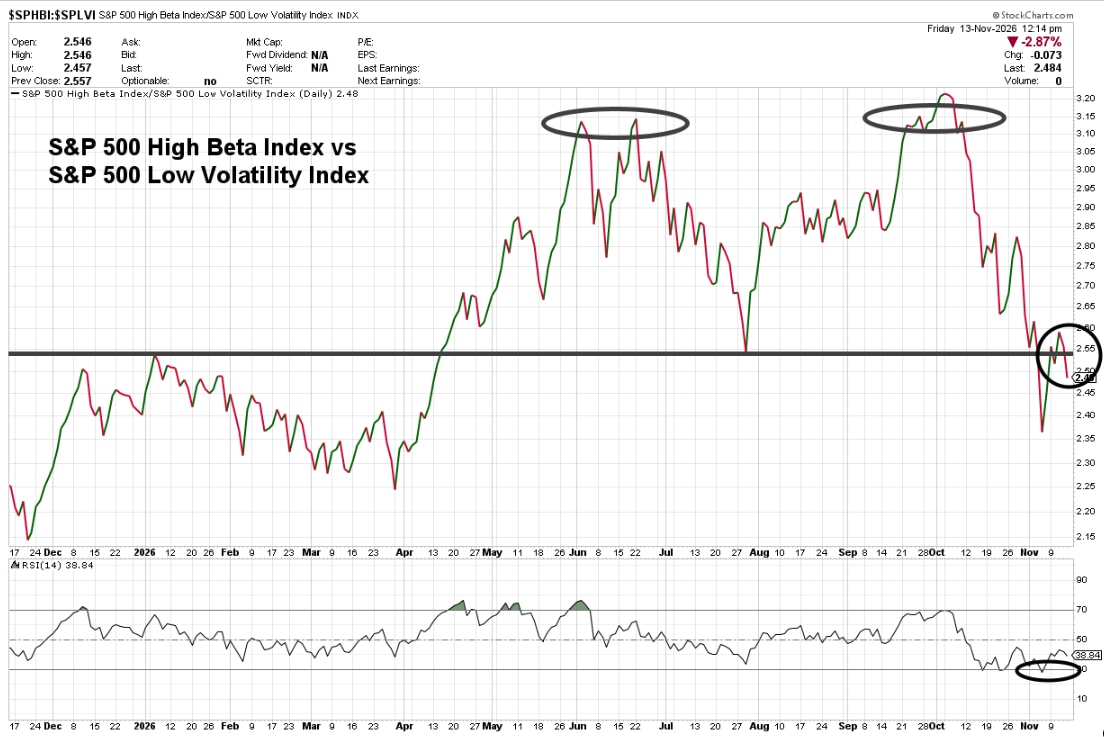
MarketS&P 500 High Beta vs. Low VolatilitySupportSee belowResistanceSee belowTechnical ViewRisk-reducing
-
MarketNasdaq-100 IndexSupportDouble-top former neckline ~27,200Resistance200-day SMA ~ 27,840Technical ViewBearish
What are the markets doing this week?
Defensive and late-cycle leadership, stretched breadth, and a sharp increase in implied volatility were among the focal points for equity markets last week.
This week, investors and traders may be focused on:
- Double-top breakdowns in the S&P 500 and the Nasdaq-100
- Relative risk-appetite relationships pointing to a risk-reducing market regime
- Relative strength in value vs. growth as a longer-term shift in market leadership
- A potential head-and-shoulders top in small caps and the potential for further downside
- Defensive and late-cycle leadership persisting in a developing "stealth bear market"
- Crude oil pausing at a key confluence of support as energy prices lose momentum
Taken together, these intermarket developments continue to suggest a more defensive technical backdrop. Several markets are testing or crossing important support or resistance zones, while trend and volatility indicators point to the potential for larger price swings. The weight of the evidence appears to be shifting toward increased downside risk for equity markets. However, oversold conditions in relative risk relationships and Technology could set the stage for a very near-term bounce.
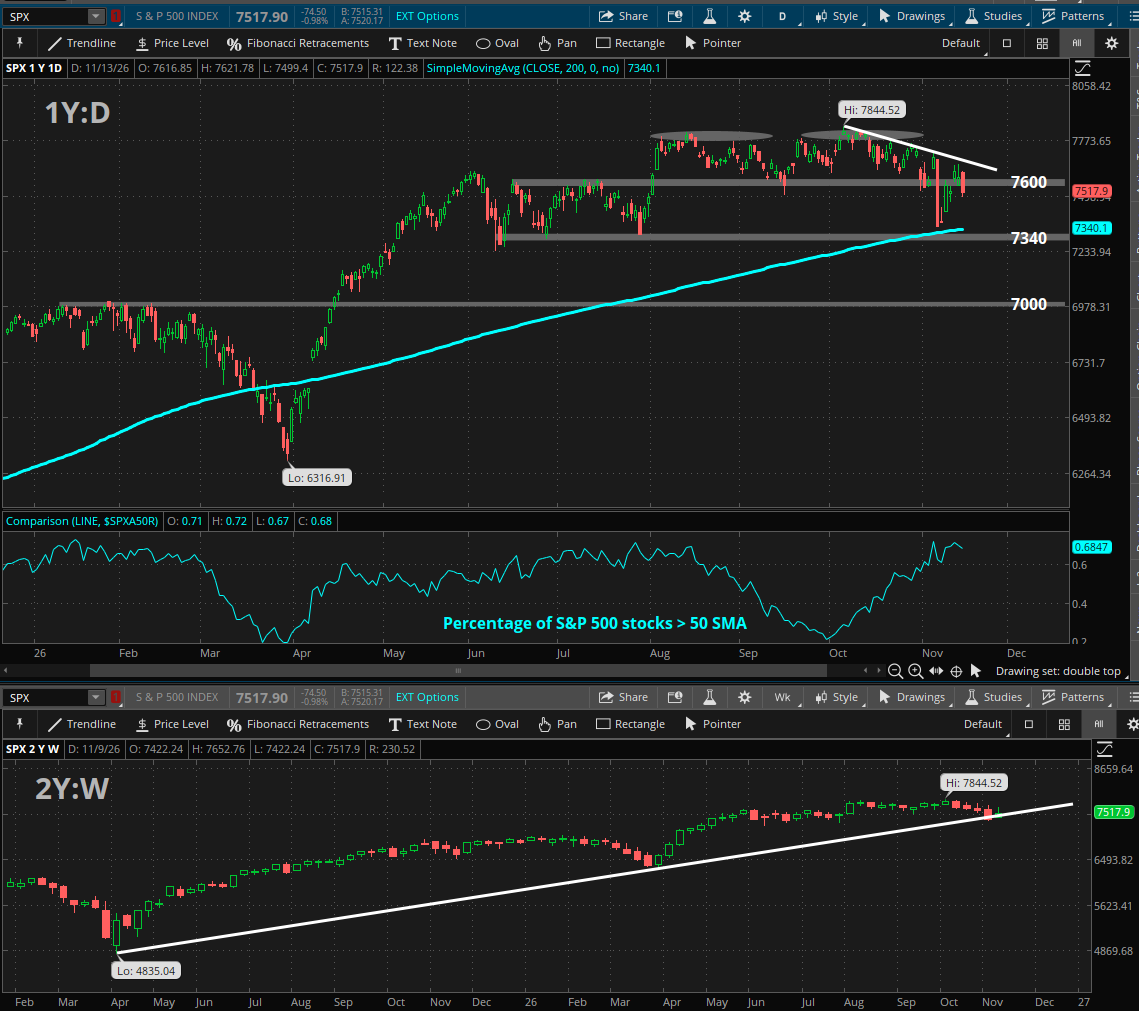
Technical takeaway #1: S&P 500 completed its double top bearish reversal pattern
Source: ThinkorSwim trading platform.
See our full list of technical analysis terms. Past performance is no guarantee of future results.
The S&P 500 completed its double-top pattern, with old neckline support near 7,600–a level that may act as new potential resistance. Using classical charting techniques, the pattern carries a measured objective near the summer lows at the 200-day simple moving average (SMA) around 7,300. Pattern price objectives are not guaranteed to be reached, and technical patterns can fail. Technicians may be watching to see if that level gets tested this week. If it breaks, the next zone of potential support may sit near February highs around 7,000.
Momentum appears to be accelerating to the downside, as the relative strength index (RSI) is near oversold territory at 35 (an RSI reading below 30 is considered by technicians that an asset/security may be oversold). Technicians may be looking for downside momentum to persist below these levels before setting the stage for a potential mean reversion in the index.
Conditions both at the index level and beneath the surface may suggest that a "stealth bear market" is continuing to develop, with deterioration becoming increasingly apparent across the broader market.
The last time the S&P 500 experienced a one-day downside rate of change of this magnitude was near the April 2025 correction lows. Before that, similar readings occurred multiple times during the 2022 bear market and during the COVID-19 decline. Notably, every other instance over the past 10 years occurred while the S&P 500 was below its 200-day SMA. Historically, declines of this magnitude have been more characteristic of bear-market environments than bull-market environments, although past performance is no guarantee of future results.
Technical takeaway #2: Russell 1000 Growth relative to Russell 1000 Value breaks below former cycle highs
Source: ThinkorSwim trading platform.
See our full list of technical analysis terms. Past performance is no guarantee of future results.
The Russell 1000 Growth index relative to Russell 1000 Value index has shown downside follow-through after breaking an important support zone that has been monitored over the past several years and aligns with prior cycle highs.
Since 2024, this polarity zone has coincided with periods where relative performance stabilized before improving in favor of growth. In technical analysis, the more times a level is tested, the more significant some technicians consider an eventual break.
Growth continues to weaken relative to value, providing further evidence that the shift in market leadership may persist. This rotation could continue to have implications for sector and broader index performance, particularly given the significant influence growth-oriented stocks have had on market returns in recent years.
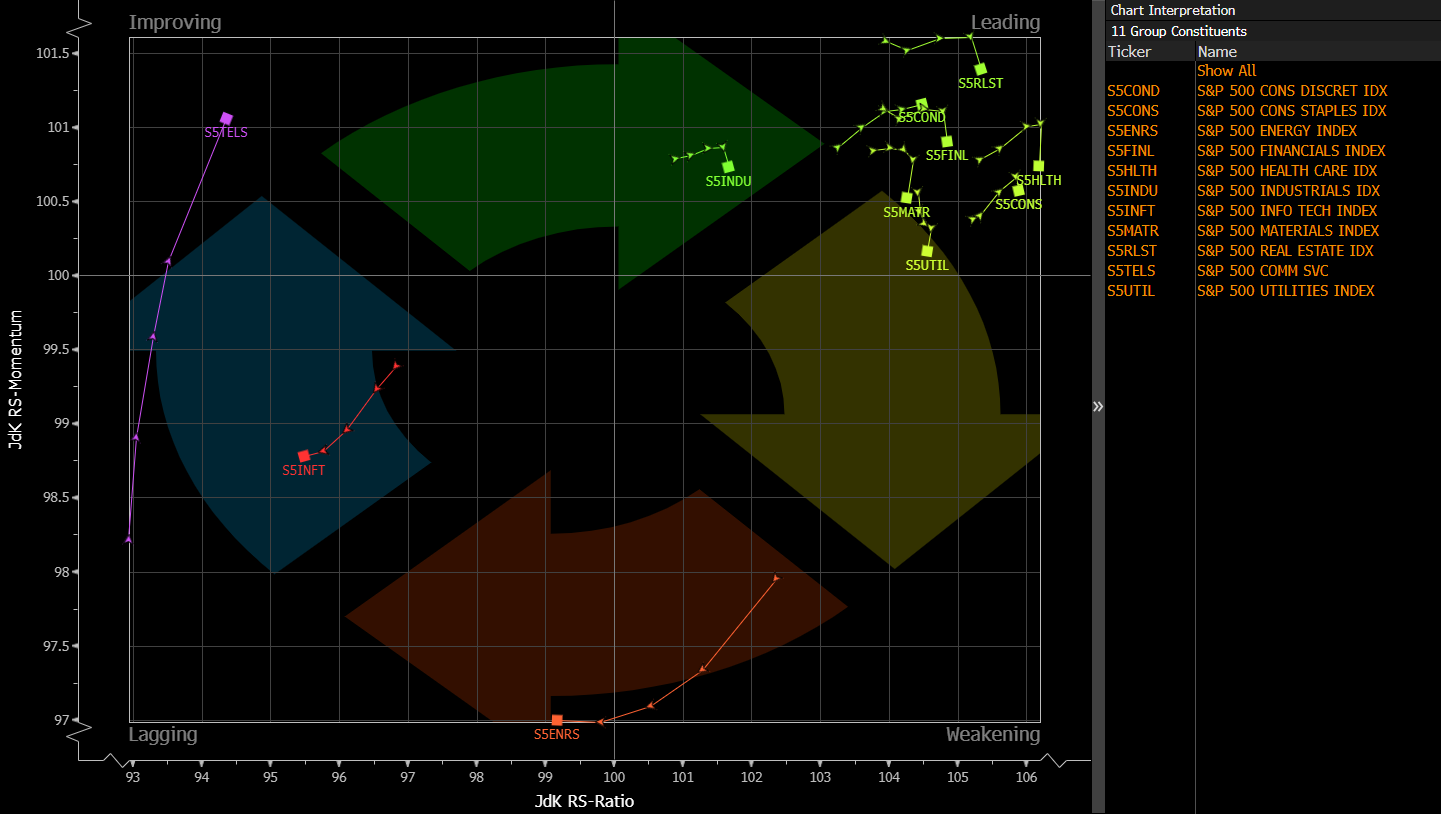
Technical takeaway #3: Sector rotation and relative strength vs. S&P 500
Source: ThinkorSwim trading platform.
See our full list of technical analysis terms. Past performance is no guarantee of future results.
You may have heard the old Wall Street adage, "Sector rotation is the lifeblood of a bull market." While rotation can help broaden participation, not all rotation is necessarily bullish.
Energy has appeared to show the first signs of rolling over and weakening relative to the S&P 500 as of last week. Healthcare, Financials, Materials, and Consumer Staples have reached new relative six-month highs versus the S&P 500. Meanwhile, Utilities and Real Estate, sectors that have historically tended to outperform during bear markets, reached new three-month highs versus the broader market.
Conversely, Technology, which represents roughly 36% of the S&P 500, reached new six-month lows relative to the index.
The increasingly defensive nature of this rotation raises the possibility of a developing "stealth bear market," where former leadership weakens before that deterioration becomes fully reflected in the major indexes. While this does not necessarily signal an imminent bear market or recession, the change in leadership may be an important development to watch.
One potentially more constructive development is the broadening of leadership into the more cyclical Consumer Discretionary sector, which reached new five-month highs last week. Technicians may be monitoring this group and other cyclical groups to see if the "stealth bear market" begins to lose steam.
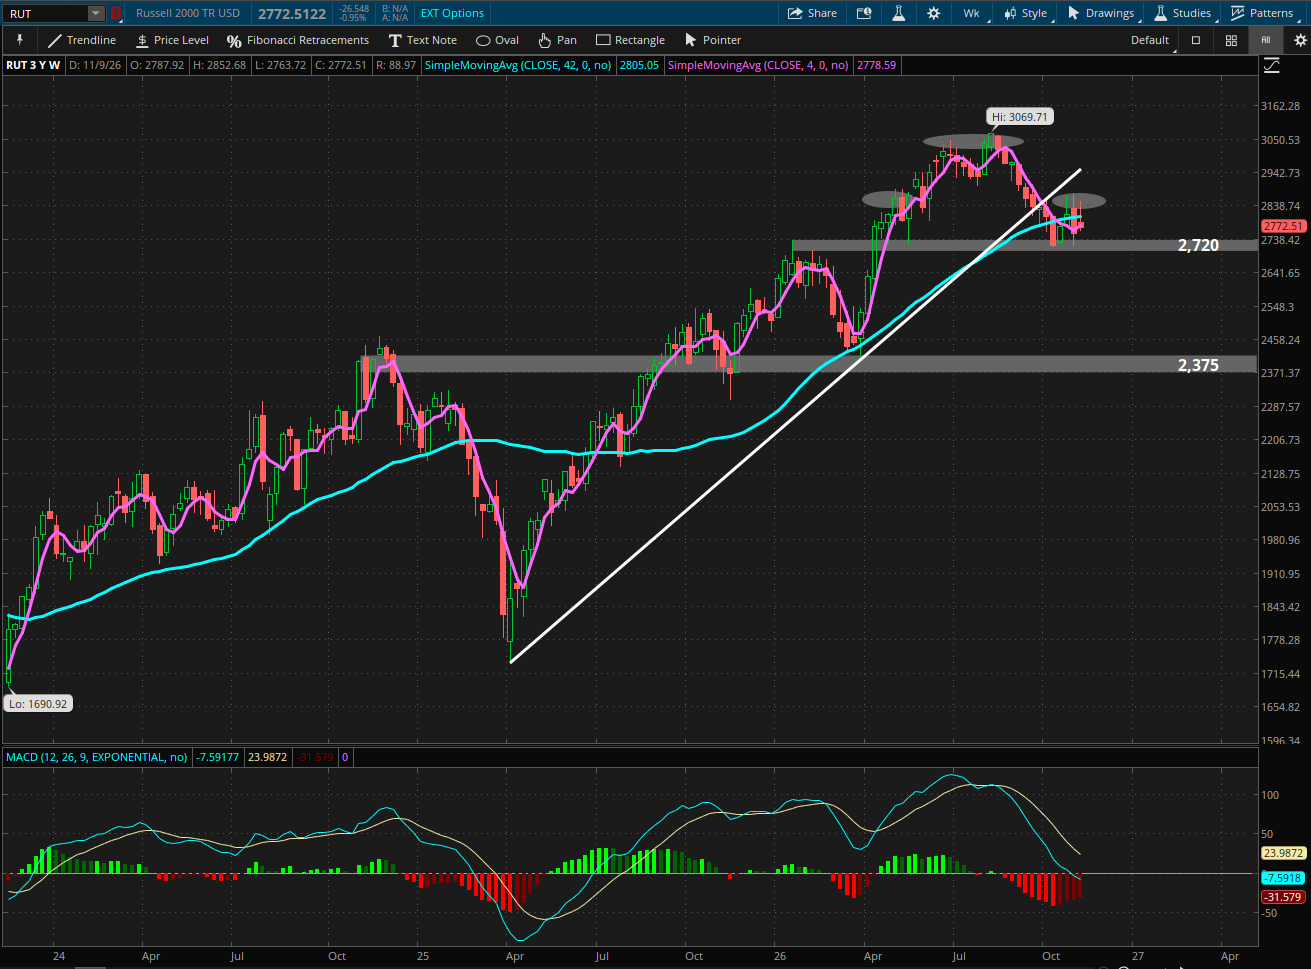
Technical takeaway #4: Russell 2000 sits near neckline support of its potential head and shoulders pattern
Source: ThinkorSwim trading platform.
See our full list of technical analysis terms. Past performance is no guarantee of future results.
In prior weeks, I've discussed how the Russell 2000 has appeared to form a longer-term "death cross" (which occurs in this instance when the four-week SMA crosses below the 42-week SMA), a development that has historically been associated with deteriorating trend conditions and, in some instances, additional drawdowns.
But something more striking about the shorter-term price action has caught my eye this week.
The Russell 2000 has been forming a potential head-and-shoulders pattern since mid-April with neckline support sitting near 2,720. As price has appeared to pause at this key zone, momentum may be providing additional clues regarding the trend. The moving average convergence divergence (MACD) has been in a bearish regime, with the MACD line below zero, since late August. Despite near-term upside momentum, the MACD appears to be moderating and looks as though it may form a bearish crossover this week.
If downside momentum ensues and the index breaks below this neckline support of its potential multi-month topping formation, technicians may monitor the April gap between roughly 2,550-2,600 as a window of potential support. Using classical charting techniques, a measured objective of the potential head-and-shoulders places the Russell 2000 near March lows around 2,400. Technical patterns can fail and measured objectives are not guaranteed to be reached.
On the other hand, if neckline support near the January highs holds, potential resistance may be near October highs around 2,870.
Technical takeaway #5: 10-year Treasury yields continue lower after their head-and-shoulders break
Source: ThinkorSwim trading platform.
See our full list of technical analysis terms. Past performance is no guarantee of future results.
Two weeks ago, 10-year Treasury yields completed a head-and-shoulders bearish reversal formation after breaking through neckline support and the 50-day SMA near 4.95%. This former support zone may now act as potential near-term resistance. Using classical charting techniques, the formation carries a measured objective near 4.6%, close to the 200-day SMA, which may represent longer-term support. Price objectives are not guaranteed to be reached. Near-term support may sit near former consolidation highs around 4.75%.
Momentum has accelerated to the downside, with RSI near oversold territory at approximately 37. Technicians may be looking for downside momentum to persist below these levels before setting the stage for a potential mean reversion in the index.
Technical takeaway #6: Crude oil tests a confluence of support as it forms a potential double-top pattern
Source: ThinkorSwim trading platform.
See our full list of technical analysis terms. Past performance is no guarantee of future results.
Crude oil appears to be testing a key technical zone after breaking below trendline support of its rising channel.
The $87-89 area contains four layers of potential support: 1) polarity: where former resistance may be acting as support; 2) anchored volume-weighted average price (AVWAP) from summer lows; 3) 200-day SMA; and 4) the potential double-top neckline.
If that neckline were to break, classical charting techniques would suggest a measured objective near the summer lows around $67, although technical patterns can fail and measured objectives are not guaranteed. If the pattern fails and crude holds or quickly recaptures this support zone, technicians may look toward the former highs near $105 as potential resistance.
But perhaps more interesting is what's happening in Energy. The sector had been a relative leader, but its relative strength versus the S&P 500 has recently broken its rising trendline.
If crude loses support while Energy continues to weaken relative to the broader market, that could signal an important shift in recent market leadership and potentially further rotation into other areas of the market.
Technical takeaway #7: Relative relationships may be signaling risk-reducing behavior
Source: StockCharts.com.
See our full list of technical analysis terms. Past performance is no guarantee of future results.
Two relative relationships that can provide insight into overall risk appetite and the current market regime appear to have decisively broken neckline support of multi-month double-top formations. The first, being the S&P 500 High Beta Index relative to the S&P 500 Low Volatility Index (pictured) and Technology relative to the S&P 500 (not pictured).
These breakdowns may indicate that the market may be shifting toward a more risk-reducing environment rather than a risk-embracing one.
However, it's important to note that both relative relationships have reached oversold conditions in the relative strength index (RSI). Technicians generally consider an RSI reading below 30 to indicate that a security or ratio may be oversold. While oversold readings are sometimes associated with the potential for a near-term bounce, they can also be a byproduct of strong downside momentum and do not necessarily signal a trend is ready to reverse. A move back above 30 may provide additional evidence of improving momentum.
Taken together, technicians may continue to monitor these relationships for signs of whether the recent shift towards more defensive leadership persists.
Technical takeaway #8: Nasdaq-100 Index completed its double top pattern as it reaches oversold momentum conditions
Source: ThinkorSwim trading platform.
See our full list of technical analysis terms. Past performance is no guarantee of future results.
This week, the Nasdaq-100 completed its double-top formation with old neckline support near 27,200, which may become new potential resistance. If the index cannot scale above that near term ceiling this week and reclaim its 200-day SMA, technicians may be watching former highs near 25,900 as another zone of near-term support. Now using classical charting techniques, its measured objective would be near the yearly lows around 22,840, though technical patterns can fail and measured objectives are not guaranteed to be reached.
The RSI fell below 30 into oversold territory, a condition that coincided with mean reversions in March earlier this year. A move back above 30 may provide additional evidence of improving momentum.
Positioning data in E-mini Nasdaq-100 futures continue to capture attention. According to Commitment of Traders (COT) data, large speculators remain near some of their most net long positioning of the last five years, currently near the 97th percentile. Perhaps more notable is the speed of the shift, with positioning moving from the 0th percentile in August to the 100th percentile just three weeks ago. The magnitude and pace of that change have been unusual relative to the past five years.
Conversely, commercial hedgers are near some of their most net-short positioning over the same period. Some technicians may view the combination of elevated speculative longs and extreme commercial shorts as supportive of a more cautious or bearish outlook. Positioning data is not predictive and should not be used in isolation, but these extremes may suggest that downside risks warrant closer attention.