Using Options Volatility Data to Research Moves

Sentiment analysis tools are helpful resources for traders when analyzing time horizons or tracking the potential velocity or magnitude of a move. Tactically, sentiment measures—including the thinkorswim® platform tools discussed below—offer estimated ranges for a security during a certain time period.
By analyzing the behavior of the options-trading crowd through these sentiment gauges, traders have another tool to help determine when it might potentially be time to build a new position, add a hedge, or plan for a potential reversal.
Tracking volatility on thinkorswim
While traders may consider many sentiment indicators—including the put/call ratio, short interest, and more—these are available in one view and are primarily based on pricing in the options market.
1. Implied volatility
Implied volatility (IV) is a dynamic percentage that represents the market's expectation of an underlying security's future price range. Calculated from the prices of options contracts, IV reflects the risk traders associate with the underlying security. High IV suggests options traders expect significant movement—either up or down—while low IV indicates that the options market anticipates more stable price action in the underlying. Essentially, IV helps options traders gauge the potential range of future price changes in the underlying security.
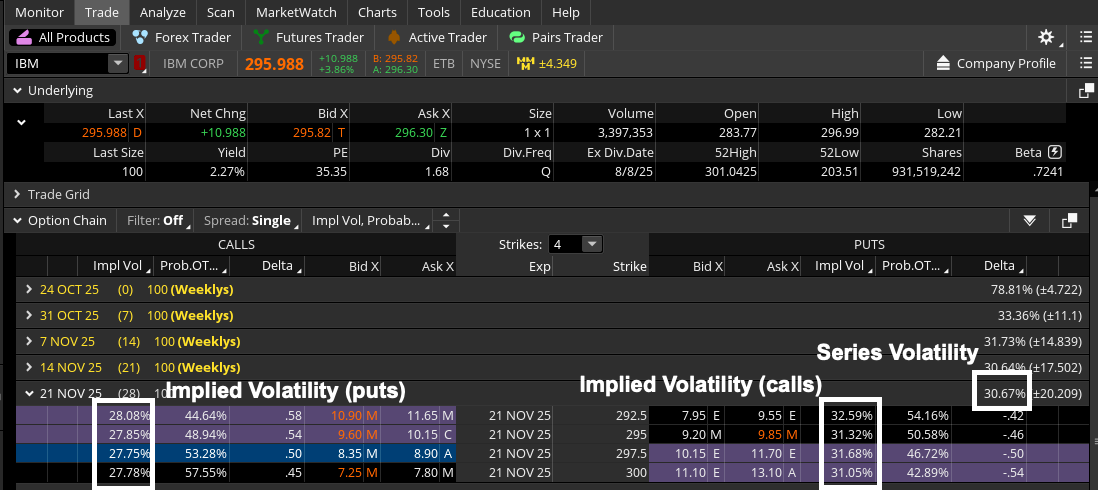
For example, if a trader buys a 110-strike call with the underlying security at $100, the underlying must move 10 points for the option to enter in-the-money (ITM) territory. If the buyer paid $1 for the option, the break-even price for the call at expiration is $111, which means the volatility that's implied by this option is 11% per year. Even in the best of times, we obviously must assume there is some probability that either the buyer or seller are wrong, so this is a one standard-deviation move, meaning we assume the underlying security is within this range around 68% of the time. Within the Option Chain on thinkorswim, traders can see the implied volatility readings for each individual option.
2. Series volatility
Implied volatility is typically different across different strike prices, which allows option traders to trade a security's volatility separately from its price. But when trying to analyze where (and by how much) a security might go, it's helpful to aggregate the individual options' implied volatilities up to the series level, representing all options that share the same expiration. For each expiration date in the Option Chain, thinkorswim displays the annualized total number for that expiration date's options separately from the individual strikes (see below).
Source: thinkorswim platform
Past performance is no guarantee of future results. For illustrative purposes only.
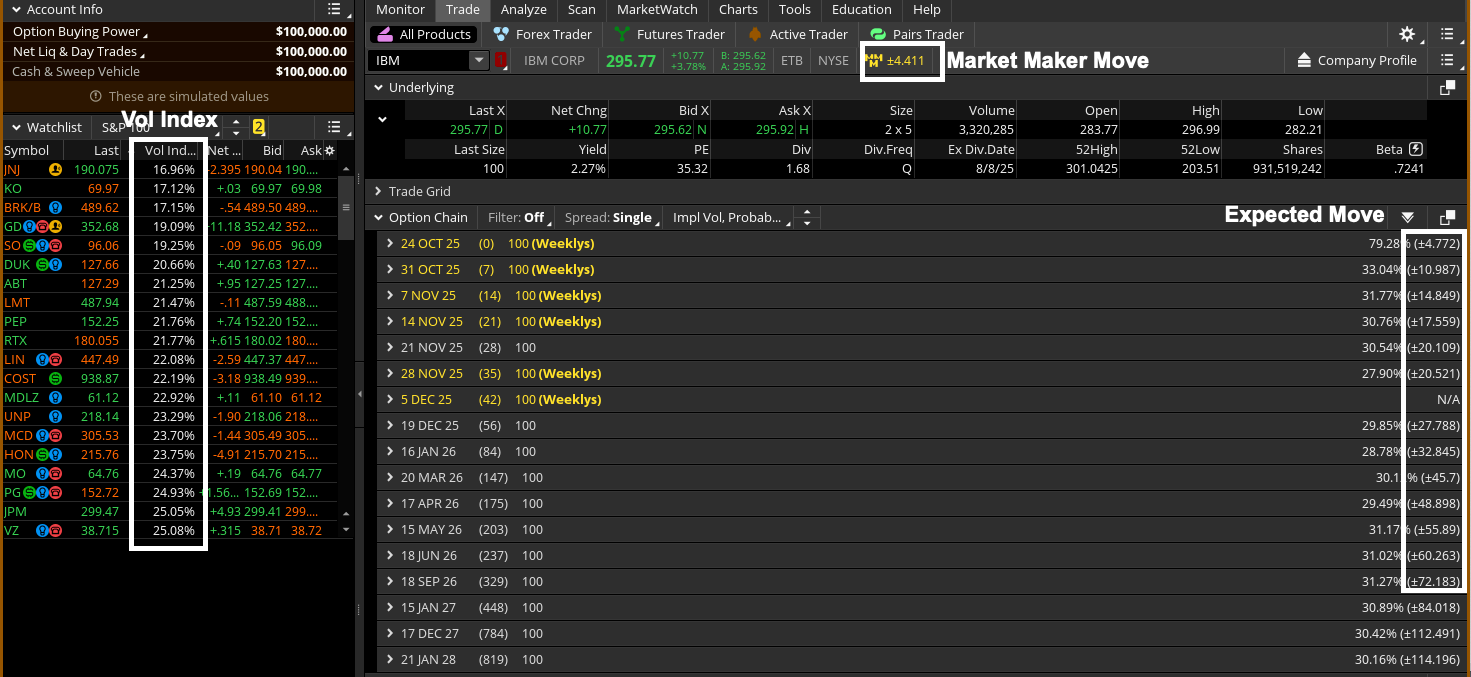
3. Expected move
This figure provides the absolute dollar value of an options series' expected move by a particular expiration date (as priced in by option traders). This is the non-percentage value shown on the far right of each options series header. Although the expiration date doesn't affect traders directly, this kind of benchmark is theoretically a forward-looking indicator that can complement traditional charting methods.
The above option chain for IBM reflects a series volatility of 30.67% for the year. This annual volatility reading corresponds to a move of roughly 20.2 points (higher or lower) within the 28 days before November 21 series options expire. By using this indicator, traders can compare one series to another to see how relatively high/low they are. In the above scenario, the series volatility reading for the October 24 weekly options was notably higher, near 79%, likely because IBM reported earnings on October 22.
4. Vol index
This reading reflects the composite series volatility of the underlying security itself. This measure—often referred to as a security's implied volatility—can be useful in understanding what the volatility for the underlying security is. If you ever see the "implied volatility" of a stock, for instance, this refers to the volatility index, not the implied volatility expressed for individual options contracts. Traders can visualize the Vol Index by adding the Probability of Expiring Cone study to the chart.
5. Market Maker Move™ (MMM)
thinkorswim displays this value when the volatility of the front-month options expiration is higher than the volatility of the next expiration. When a security meets these conditions, the MMM appears at the top right of the Trade tab in a yellow box when its symbol is entered. Based on the options market's supply and demand, volatility is the amount of uncertainty reflected in a security's value. Higher demand for options (buying to open calls or puts) will lead to higher volatility as options premiums increase. Low demand (selling to close calls or puts) will cause lower volatility.
When MMM is present, it implies there's some event in the near term—such as earnings—that might shift the price of the underlying security. The MMM is a derived figure that separates volatility inherent in time value from the "extra" volatility attributed to the upcoming event. This reading potentially illustrates the amount of movement the market expects the event may cause and uses a larger range than the usual one standard deviation because these events have the potential to move prices into lower-probability ranges. This reading does not definitively predict how much a stock will move—or in which direction; it merely reflects what the options market is currently pricing in, based on the outlook of option traders and the perspective of market makers, which is where the value gets its name.
Source: thinkorswim platform
Past performance is no guarantee of future results. For illustrative purposes only.
Bottom line
While these tools cannot predict price movements, they can help traders fold in sentiment analysis to help forecast the magnitude and timing of an underlying stock's anticipated move. Used regularly, these tools can help complement the fundamental and/or technical analysis traders use in their decision-making process.