Using thinkorswim® to Spot Sector Strength
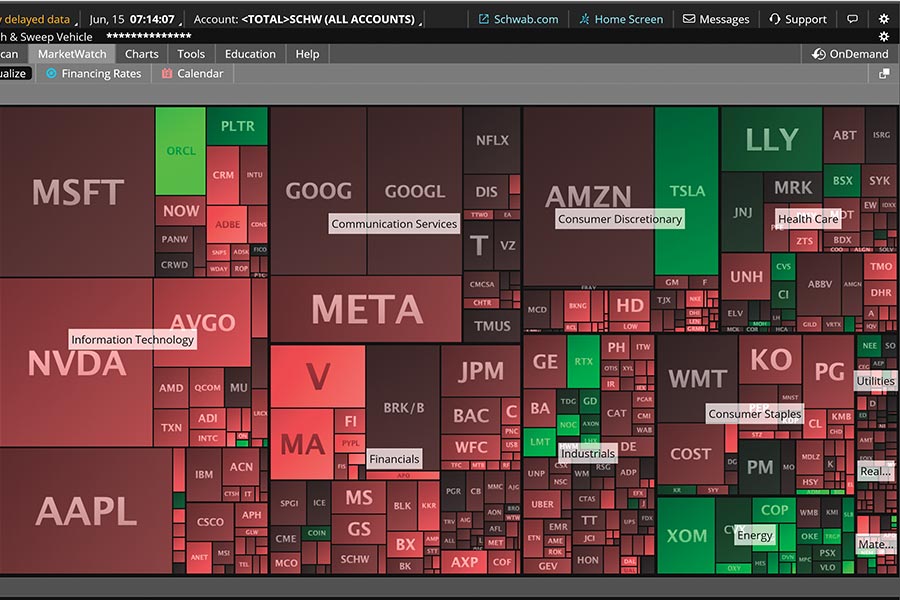
Focusing on specific sectors can help traders cut through the noise of the broader market and spot emerging strengths. The Heat Map feature on Schwab's thinkorswim® trading platform can help identify not only which sectors recently outperformed but also the companies that drove that momentum.
To begin, log in to the thinkorswim desktop platform.
Getting started
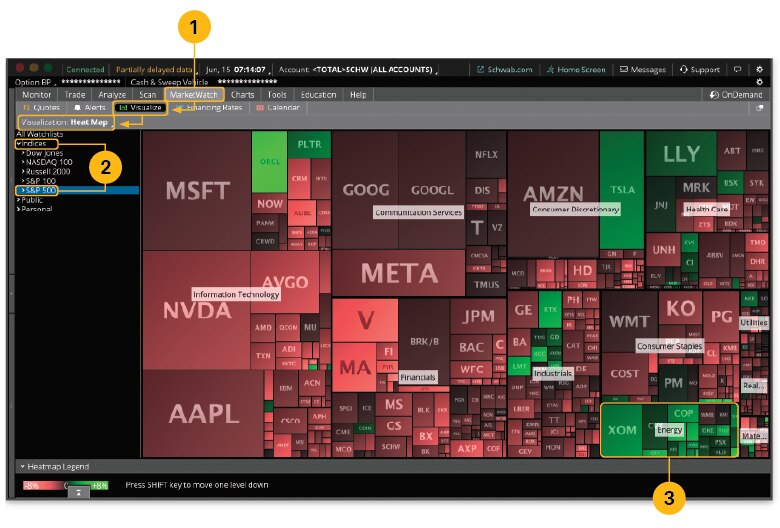
Source: thinkorswim® desktop platform for Mac.
- From MarketWatch, select Visualize, then Heat Map from the Visualization dropdown.
- Under Indices, choose an index. For this example, we've selected S&P 500.
- Once the heat map populates, you can see which sectors recently outperformed relative to their peers. Here, Energy is up on a day when the wider market is struggling.
Interpreting the Heat Map
- Square color: Indicates the stock's daily price change—the brighter the green or red, the greater the positive or negative change, respectively. (No color means no change.)
- Square size: Indicates the company's market capitalization.
A deeper dive
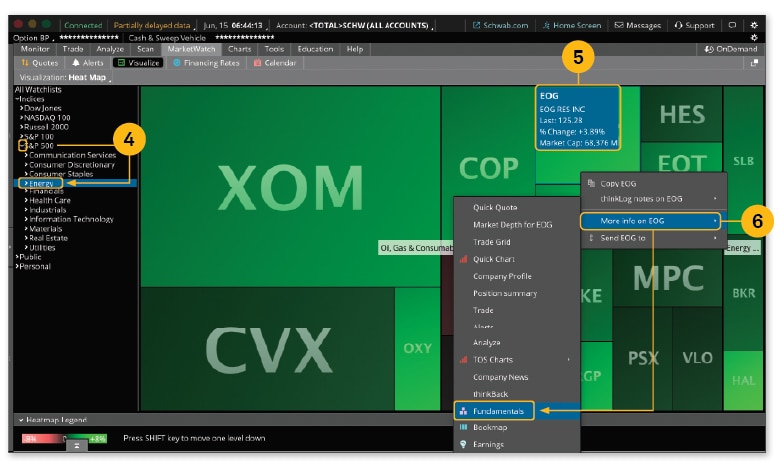
Source: thinkorswim® desktop platform for Mac.
- For a closer look at the Energy sector, click the arrow next to the index name to reveal the sectors, then select Energy.
- Hover your cursor over any square to see the stock's name, last price, daily percent change, and market capitalization.
- For a deeper dive into what's driving that stock, click the square, move your cursor over More info on, then select Fundamentals.
Company fundamentals
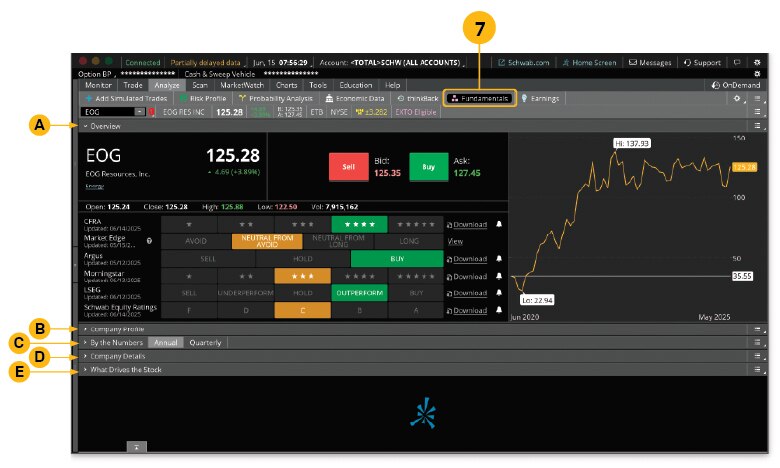
Source: thinkorswim® desktop platform for Mac.
- The Fundamentals page provides a wealth of information to deepen your research into a specific company, including: 🅐 Overview of the stock, 🅑 Company Profile, and 🅒 By the Numbers—a breakdown of the company's financials. Some companies, like this one, may also include 🅓 Company Details and, for S&P 500® companies, 🅔 What Drives the Stock.
The bottom line
The Heat Map is an efficient way for traders to zero in on sector standouts and compile a short list of stocks for additional research. From there, traders can use their preferred technical indicators or fundamental screens to evaluate their picks and trade with greater confidence.
Schedule a call with a Trading Solutions specialist.
Discover more from Onward

Keep reading the latest issue online or view the print edition.