Valuing Crypto Through the Lens of a 51% Attack

Key takeaways
- In our view, the cost of executing a 51% attack on the Bitcoin network may rise with network growth, as higher hashrate could increase both the capital and coordination required, which could reduce the likelihood of such attacks. We interpret this as suggesting that Bitcoin's security may be economically self-reinforcing.
- Under the assumptions used in our analysis, even when incorporating large double-spend assumptions, the estimated total cost of attack—including capital expenditures (capex) energy, and competition—may exceed the potential extractable value, particularly when accounting for market and network responses.
- We believe that real-world constraints—hardware supply, energy infrastructure, time-to-build, and miner competition—may make it difficult to acquire and sustain majority hashrate, meaning the threshold for a 51% attack could be a moving and increasingly unreachable target.
- Our findings suggest that one way to frame bitcoin's value is through five interacting constraints: scarcity, energy, competition, probability, and limited extractable value, which together may help explain why attack costs could remain structurally higher than potential rewards under certain circumstances.
We previously wrote about bitcoin miners' pivot to high-performance computing (HPC) for artificial intelligence (AI), and why we feel that increases network security over time. In our view, when more miners are active on the network and participation is broader, the blockchain may become more resistant to an attack because majority control of the network may become more difficult for any single entity or coordinated group. For a decentralized, permissionless, public blockchain, this is a core feature to enable trust in the network.
A 51% attack is an attempt—by an individual or a group—to control more than half of a blockchain network, which could theoretically give an attacker the ability to receive block rewards, transaction fees from previously mined blocks, and potentially capture double-spend transactions (where the same cryptocurrency is spent more than once). In the case of a 51% attack, the attacker could theoretically alter previous transactions, delay transactions in process, and affect the ability for the correct version of the network to be maintained going forward.
We believe that as the Bitcoin network continues to grow, its security may become self-reinforcing and 51% attack attempts become expensive and limited by physical capex constraints and mathematics. The cost of executing a 51% attack rises with network growth, as higher hashrate increases both the capital (for hardware and energy) and coordination required, which could make attacks less economically feasible at scale, depending on assumptions about costs, timing, and potential payoff. Hashrate is the total computational power used by miners to secure the network and validate transactions. In mining, a hash is a single attempt to solve Bitcoin's cryptographic puzzle. One exahash is equal to one quintillion hashes. Hashrate is measured in exahashes per second (EH/s) and a higher hashrate is generally associated with a more secure network, although it isn't the only factor affecting network security.
In this article, we explore the economics of a 51% attack, why the Bitcoin network's growth has historically made it cost prohibitive to achieve this type of attack, and how this can be used as one possible way to estimate fair value for proof-of-work cryptocurrencies like bitcoin.
But before moving on, it's helpful to define a few more key concepts:
- Proof-of-work is a process where computers (miners) compete to solve a mathematical puzzle. The first miner to find the solution earns the right to add the next block of transactions to the blockchain and receives a reward.
- Percent of Bitcoin network hashrate refers to a miner's estimated share of the total computing power securing the Bitcoin network.
- Operating hashrate represents the amount of computing power that an individual miner or mining company is actively running through its mining equipment.
- Network hashrate is the estimated aggregate computing power contributed by all miners participating in the Bitcoin network. While a miner's operating hashrate can be compared against total network hashrate to estimate its share of the network, the two measure different things and should not be used interchangeably.
- A mining pool is a group of bitcoin miners that combine their computing power to improve their chances of successfully mining blocks. Any rewards earned are then distributed among participants based on the amount of computing power they contribute, subject to the pool's payout structure and applicable fees.
Our analysis of a 51% attack may help illustrate factors that reinforce the security of the Bitcoin blockchain, reveal how it balances security, decentralization, and scalability, and may offer one possible framework for valuing bitcoin as an investment.
A blockchain can optimize two of three core features
Vitalik Buterin (co-founder of the Ethereum blockchain), coined the term "the blockchain trilemma," which describes a feature of many blockchain ecosystems wherein they must optimize two of three core variables—security, decentralization, and scalability—at the relative expense of the third.
Scalability refers to how fast a blockchain network can process transactions. The primary issue that security aims to solve is a situation where an individual, or group of individuals, could take control of 51% of the network and potentially censor (block, manipulate, or delay) transactions. Decentralization refers to how broadly control and participation are distributed across a network, including who can validate transactions, enforce rules, and influence changes to the protocol. In Bitcoin, network changes generally require broad adoption by the participants that run and enforce the software—like node operators, miners, developers, exchanges, wallet providers, and users—rather than approval from a single central authority. Bitcoin owners do not vote on changes simply by holding bitcoin, and miners alone cannot rewrite the network's rules without the broader network accepting those changes. This distribution of roles helps limit the ability of any one party to unilaterally control the system.
The 10 largest publicly traded bitcoin miners by operating hashrate represent 35.4% of the Bitcoin network hashrate
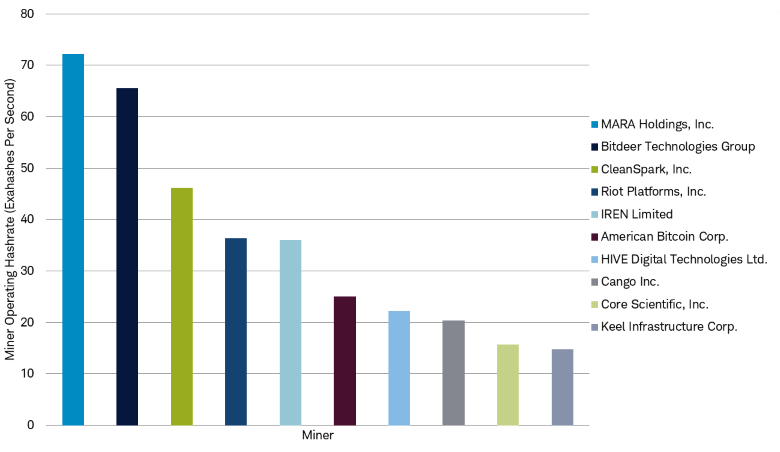
Source: Schwab and the Securities and Exchange Commission annual Form 10-K filings, as of June 30, 2026.
Operating hashrate reflects each miner’s most recently reported active mining capacity. Percentages are calculated by comparing each miner’s reported operating hashrate with estimated total Bitcoin network hashrate to approximate that miner’s share of total network hashrate. Total network hashrate is approximately 1,000 EH/second.
All corporate names and market data shown are for illustrative purposes only and are not a recommendation, offer to sell, or a solicitation of an offer to buy any security and are not intended to be, nor should they be construed as, a recommendation to buy, sell, or continue to hold any investment.
Key debate: Does mining pool concentration undermine bitcoin’s decentralization?
While the 10 largest publicly traded bitcoin miners by operating hashrate collectively represent 35.4% of the Bitcoin network hashrate (based on Schwab analysis of data reported in miners' Securities and Exchange Commission annual Form 10-K filings as of June 30, 2026), a common criticism is that many of the miners on the network operate in mining pools. According to HashrateIndex.com, four mining pools represented roughly 70% of observed Bitcoin network hashrate as of June 30, 2026, though that figure reflects pooled mining activity rather than direct ownership or control by a single entity.
One perspective on this debate is that due to the high concentration in these mining pools, Bitcoin is highly centralized. The other perspective points to the fact that individual miners make up the mining pool and are thus economically incentivized to maintain the honest blockchain. If a miner, or a group of miners, was trying to put forth false versions of the blockchain, the rest of the miners may have economic incentives to reject or counter that version, though outcomes would depend on market and network conditions.
Schwab's perspective is that although mining pools do concentrate compute (which is the ability of a system to perform calculations at scale), ultimately the economic incentives and competition among individual miners may help support the integrity of the blockchain. When there is true consensus, that keeps miners working together. Otherwise, they may exit the pool, or start a different pool, to maintain the correct version of the blockchain, though doing so could involve operational or economic frictions. Understanding the actual incentives for mining reinforce our view that Bitcoin is not centralized, even when accounting for mining pools.
Summary of crypto key debates
| Cryptocurrency | Sector | Industry | Industry Standard Network Effects | Leading Market Share | Scalability | Tokenomics | Key Debate(s) | Trading Range | Current Valuation |
|---|---|---|---|---|---|---|---|---|---|
| Bitcoin | Foundational Networks | Store of Value | ✔️ | ✔️ | ❌ | Below Average |
1) Quantum risk 2) Miner pivot to AI 3) Halving cycle persists? 4) Mining pools create centralization |
0.75x-2x Inefficient Miner Production | 0.85 Miner Production |
| Ether | Foundational Networks | Smart Contract Platform | ✔️ | ✔️ | ❌ | Average | Ethereum scalability | 40x - 70x Market Cap/"GDP" | 28x Market Cap/"GDP" |
| XRP | Foundational Networks | Store of Value | ❌ | ❌ | ✔️ | Below Average | Store of value or smart contract? | 0.1x to 0.4x Market Cap/Transfer Volume | 0.25x Market Cap/Transfer Volume |
| Sol | Foundational Networks | Smart Contract Platform | ❌ | ❌ | ✔️ | Above Average | Expand beyond meme trading? | 20x - 100x Market Cap/"GDP" | 28x Market Cap/"GDP" |
The Bitcoin blockchain is secured through a proof-of-work consensus mechanism, which ultimately results in two costs being associated with producing bitcoin: fixed costs, like mining equipment (fleets of mining rigs that run on application-specific integrated circuits, or ASICs, developed solely for bitcoin mining); and variable costs, like energy to power a data center.
The high energy costs to produce bitcoin may contribute to making it more secure. The idea behind proof-of-work is that attempting a 51% attack is prohibitively expensive, so miners are generally economically incentivized to use computing power to validate blocks rather than attempt an attack.
While a sovereign actor, like a foreign government, could theoretically have the resources to attempt a 51% attack, such an attack may be difficult to execute due to the time it would take to procure the equipment needed to control the network, the energy resources needed, and the ultimate uncertainty of whether it will be profitable.
Understanding the economics of a 51% attack suggests that higher production costs may contribute to greater resistance to certain attack scenarios. The economics can also explain why mining costs are a critical feature of a proof-of-work blockchain and why we use miner production costs as one of several metrics for valuing bitcoin, alongside other factors like market demand, liquidity, network activity, regulatory developments, and broader macro conditions.
Competition increases production cost of bitcoin, reduces likelihood of a 51% attack
The Bitcoin blockchain is a combination of timestamping and finality of previous settlements. Digiconomist estimates it currently requires about 3.75 gigawatt hours (GWh) of energy to mine a block. To provide some conservatism in our analysis, we assume it requires 2 to 3 GWh of energy to create a block. For each historical block an attacker is looking to alter, they must use the same energy (2 to 3 GWh) per block, at the same time every other miner on the network is working to secure the next block (and therefore creating a copy of the correct historical blockchain).
The cost of an attack is calculated as: Cost of attack = energy per block × blocks to rewrite × competitive multiplier.
The competitive multiplier (the additional energy and cost an attacker may need to overcome competition from honest miners) is critical because if you only have 50% share of network hashrate, progress is slow. But if you have 60% to 70% share of network hashrate, you may be able to catch up—but at a high cost.
To put some numbers in this example: if 3 GWh of energy is needed per block, and the attacker wants to alter the previous six blocks, that requires 18 GWh of energy—which is enough to power nearly 1,670 U.S. homes for a year, based on the U.S. Energy Information Administration's (EIA) 2022 estimate of average annual electricity consumption per U.S. residential utility customer.
This example illustrates why reversing confirmed blocks is difficult in practice and how an attack requires industrial-scale coordination. If the attacker controlled 60% of the network's hashrate, they could potentially outpace the network in terms of block creation, but there are significantly higher costs compared to honest mining.
Under this simplified model, the energy required to maintain majority control depends on the gap between the attacker's share of network hashrate and the share controlled by honest miners (defenders). The relationship can be expressed as:
Energy required per block × [1 / (attacker's share of network hashrate − defender's share of network hashrate)]
Or in our example: 1 / (0.6 – 0.4) = 5
This means the attacker needs 90 GWh—five times the baseline 18 GWh. Using $40 (the average cost of wholesale electricity according to the EIA as of June 30, 2026) per megawatt-hour, this means the attack costs $3.6 million to alter the previous six blocks. The gain if the attacker were to alter the history and capture the block rewards and transaction fees for the previous six blocks, using $75,000 as a hypothetical price for bitcoin, would be $1.5 million for the six block rewards plus a modest amount of transaction fees. We calculated this by using 3.125 bitcoin as the block reward, multiplied that by our $75,000 hypothetical price for bitcoin, then multiplied that by six blocks.
The approximately $94,000 transaction fee amount is an illustrative assumption used in this analysis rather than a fixed or guaranteed fee level; actual transaction fees can vary materially by block and market conditions. Under these assumptions, even at the high end of the estimated transaction fees, the estimated cost of the attack would exceed the estimated rewards.
If successful in reversing the previous six blocks, the attacker doesn't need to maintain the false chain at the elevated cost because it would become the consensus chain. As a result of the attack, two scenarios might happen: (1) the network carries on with the false history; or (2) the network collapses—either voluntarily through a fork, where the chain splits into two or more separate branches, or a complete loss of confidence in the network. One scenario in which the attack may be viable is if the network carries on with the altered history, which ignores one key aspect of a decentralized blockchain network—competition among miners and economic self-interest.
The other roadblock to a successful 51% attack is the probabilistic nature of bitcoin mining. An Independent Bernoulli trial is a random experiment with two possible outcomes, success or failure. The probability of success is fixed and each trial is independent. In the context of Bitcoin, the probability of mining a block is equal to your share of total network hashrate. To calculate the probability of mining consecutive blocks, you raise your network hashrate share to the power of the number of blocks you are looking to mine in a row. As you can see below, the likelihood of mining consecutive blocks could be low.
How competition increases the cost and reduces the impact of a 51% attack
| Hashrate share | Probability of mining 6 blocks in a row |
|---|---|
| 50% | 0.56 = 1.56% |
| 30% | 0.36 = 0.073% |
| 10% | 0.16 = 0.0001% |
All of this assumes the attacker already has the infrastructure available to support this attack. A simplistic method of calculating how much upfront capex would be required to take over 51% or more of the Bitcoin network requires some information about bitcoin mining rigs. Each mining rig has its own measure of terahashes per second (TH/s). TH/s is the unit of measurement for computational power, or the number of cryptographic hash calculations a device or network can perform in one second. One terahash equals one trillion hash attempts per second.
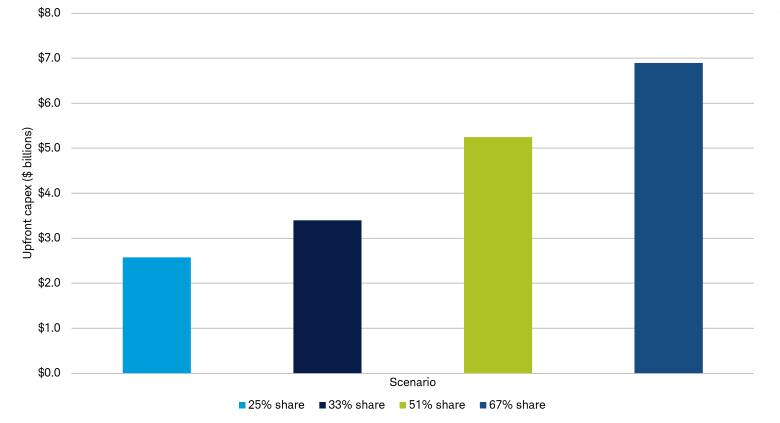
To estimate the number of machines needed to reach 51% of the Bitcoin network's hashrate, we first estimate the required hashrate: 940 EH/s × 51% = about 479 EH/s. Because 1 EH/s equals 1,000,000 TH/s, this equals 479,400,000 TH/s. Assuming a mining rig capacity of 270 TH/s, the estimated machine count is 479,400,000/270, which equals approximately 1.78 million machines, or 1,775,556 when rounded up as machines must be purchased in whole units. At an estimated $2,950 per machine (which is what a standard Antminer S21 costs), upfront hardware capex would be approximately $5.24 billion, or about $5.2 billion, before considering energy infrastructure, procurement timing, deployment delays, or other operating costs.
Total upfront capex by control-share scenario
Source: Schwab as of June 30, 2026.
For illustrative purposes only.
A simple analysis suggests it takes about $5.2 billion in upfront hardware capex to generate 51% of the Bitcoin network's hashrate.
This methodology is flawed because it assumes an attacker could acquire enough mining rigs at a single point in time and immediately deploy them. It also doesn't consider that a utility-grade energy source would be needed to power this operation, which if not available, would need to be built. Finally, how the Bitcoin network responds to miners coming onto the network would also limit the viability of this attack.
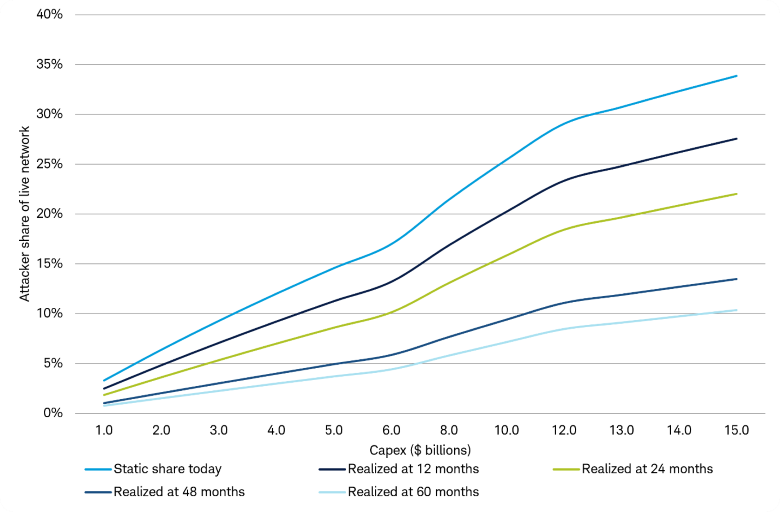
Realized attacker share versus capex under deployment delays
Source: Schwab as of June 30, 2026.
Incorporating capex, time to build, and network response illustrates how cost prohibitive it could be to initiate and maintain a 51% attack. By including production times into this simple illustrative analysis, we highlight the difficulties of capturing a majority control of a growing network.
This chart illustrates how an attacker's potential share of the active Bitcoin mining network may change depending on how much capital is deployed and how long it takes to deploy that capital. The horizontal axis shows assumed capital expenditures (capex), while the vertical axis shows the attacker's estimated share of the total active Bitcoin mining network. The "Static share today" line assumes the network does not grow during deployment. The realized share lines assume the Bitcoin network continues to grow while the attacker's mining infrastructure is being built and deployed. Under those assumptions, longer deployment periods may result in a lower realized share of the network than initially expected.
For illustrative purposes only.
A more thorough illustrative analysis attempts to incorporate capex costs and supply chain constraints in addition to the response from honest miners and bitcoin's price after the attempted 51% attack. This requires several assumptions, which may or may not pan out in a real-world scenario.
- We first assume a minimum of a two-year buildout, where the attacker can acquire the mining rigs needed and build the energy infrastructure (the permitting process for the energy infrastructure alone would likely take two years).
- We also assume that attackers can acquire 50% of production of new mining rigs during this period.
- We already calculated the upfront capex required to source the hardware (about $5.2 billion). During years of strong demand for mining equipment, maybe 2.5 million rigs are produced a year.
The energy infrastructure capex can be estimated as:
Energy buildout capex = miner electrical load + overhead x infrastructure capex per MW
Keep in mind that honest miners can temporarily shut down when it's not economically viable to mine, optimizing their data center utilization, but the attacker must run 24/7 to attempt to control the network.
How the bitcoin network might respond (game theory)
Perhaps the most important aspect to analyze is how the network might respond to the 51% attack. The key factors of the analysis include:
- A targeted share of network hashrate
- Assumptions on mining equipment costs
- Assumptions on time to acquire the mining equipment and build required energy infrastructure
- Ongoing energy costs
- Organic network hashrate growth
- How honest miners may respond
It takes time to deploy the attack. In our analysis, we used (an aggressive) two years for the complete buildout. During which time, the blockchain's hashrate would continue to grow. Network hashrate has grown 51% a year on average since November 2022 according to data from Glassnode as of June 30, 2026. So for every year that passes, the amount of network you could control based on initial capex assumptions decreases.
Beyond the moving target of network hashrate, a new miner joining the network doesn't replace existing hashrate, it may increase it, pushing up total network hashrate. This assumes existing miners remain active. In this instance, the miner now controls even less than they initially aimed to. The potential success of a 51% attack may ultimately be limited by supply chain constraints, energy constraints, and game theory. Game theory examines how strategic participants respond to incentives when their outcomes depend on the actions of others.
For context, we compare scenarios of how the network may react to a 51% attack. We use both a "static attack" where we assume the attacker has all the infrastructure ready today, and a "time-delayed" method, incorporating the two years we previously established to build the infrastructure. The network variables we introduce are whether miners stay on the network (additive), or leave the network (displacement), and how a drop in bitcoin's price could impact the operation.
Using the two-year buildout and a target of 51% of current network hashrate (940 EH/s), this results in upfront capex of about $5.2 billion for mining rigs and about $10 billion for energy infrastructure. The approximately $10 billion estimate is calculated by multiplying the required mining capacity (6,470 MW) by a 25% infrastructure adjustment factor and an assumed infrastructure cost of $1.2 million per MW. The infrastructure adjustment is intended to capture supporting capital requirements beyond the mining machines themselves, such as substations, transmission and interconnection equipment, cooling infrastructure, buildings, and other site-development costs. Under these assumptions, infrastructure capex is estimated at approximately $9.7 billion. These estimates are for illustrative purposes only.
Note that estimated Bitcoin network hashrate is rounded in some chart descriptions for readability. The 51% attack calculations use a more precise point-in-time estimate of 939.76 EH/s, rounded to 940 EH/s in the narrative. The approximately 1,000 EH/s figure in the miner-concentration chart is a rounded presentation of the same point-in-time network-hashrate estimate and is not a separate assumption. Hashrate, which is a volatile point-in-time estimate, changes on a day-to-day basis and ranges from 850 EH/s to 1,100 EH/s.
The tables also include Bitcoin mining difficulty, shown as Difficulty (T), which reflects how hard it is for miners to produce a new block. In the scenarios below, difficulty changes as modeled network hashrate changes.
Even under favorable conditions, attackers struggle to reach majority control
Static model detail: additive vs. displacement
| Case | Period | Honest EH/s | Attacker EH/s | Total EH/s | Attacker share | Difficulty (T) | Electricity cost/day ($) |
|---|---|---|---|---|---|---|---|
| Additive | Pre-retarget | 939.76 | 0.00 | 939.76 | 0.0% | 136.61 | $5,823,223 |
| Additive | Post-retarget | 939.76 | 479.28 | 1,419.04 | 33.8% | 206.28 | $5,823,223 |
| Displacement | Pre-retarget | 939.76 | 0.00 | 939.76 | 0.0% | 136.61 | $5,823,223 |
| Displacement | Post-retarget | 751.81 | 479.28 | 1,231.09 | 38.9% | 178.96 | $5,823,223 |
In this scenario, an attacker would have to target 85% of the current network hashrate from a total capex perspective—assuming 20% of honest miners were to leave the network—to achieve 51% control. At $0.10/kilowatt-hour (kWh), the percentage of the network controlled by the attacker doesn't change, but the costs to maintain the attack rise by 3.3x.
At average miner electricity rates, daily costs approach $20 million
Static model detail: additive vs. displacement
| Case | Period | Honest EH/s | Attacker EH/s | Total EH/s | Attacker share | Difficulty (T) | Electricity cost/day ($) |
|---|---|---|---|---|---|---|---|
| Additive | Pre-retarget | 939.76 | 0.00 | 939.76 | 0.0% | 136.61 | $19,410,743 |
| Additive | Post-retarget | 939.76 | 479.28 | 1,419.04 | 33.8% | 206.28 | $19,410,743 |
| Displacement | Pre-retarget | 939.76 | 0.00 | 939.76 | 0.0% | 136.61 | $19,410,743 |
| Displacement | Post-retarget | 751.81 | 479.28 | 1,231.09 | 38.9% | 178.96 | $19,410,743 |
Based on the share of bitcoin the attacker would earn per day, and taking into account different price reactions to the 51% attack, our analysis suggests it could be prohibitively expensive to control the network. If bitcoin's price were to fall because the attack became known, the attacker's daily gross profits would potentially fall even more.
Even at low power costs, attacker profitability hinges on market stability
Price collapse vs. cost curve (static model, additive share only)
| BTC price decline | BTC price after shock | BTC/day mined (additive share) | Gross mining revenue/day | Electricity cost/day ($) | Gross profit/day |
|---|---|---|---|---|---|
| 0% | $75,787 | 100.65 | $7,628,252 | $5,823,223 | $1,805,029 |
| 10% | $68,209 | 100.65 | $6,865,427 | $5,823,223 | $1,042,204 |
| 20% | $60,630 | 100.65 | $6,102,602 | $5,823,223 | $279,379 |
| 30% | $53,051 | 100.65 | $5,339,777 | $5,823,223 | ($483,446) |
| 40% | $45,472 | 100.65 | $4,576,951 | $5,823,223 | ($1,246,272) |
| 50% | $37,894 | 100.65 | $3,814,126 | $5,823,223 | ($2,009,097) |
This also illustrates why miners are generally rewarded for using their resources "for good." In our view, a secure network is a positive for all users of the network, and absent temporary price shocks, could result in a profitable operation for the attacker under the stated assumptions.
How does this look on a time-adjusted basis?
We found that the attacker's share becomes even less when incorporating time delays into this analysis. First, we assume a global annual mining rig production of 2.5 million units. We assume the attacker can acquire 50% of global rig production, with a lead time of 12 months. Using the same terahash per mining rig as before, we can convert the global rig output into a global terahash output—which amounts to 675 EH/year. The attacker would be able to acquire 50% of that resulting in about 338 EH/year. This results in about 28 EH/month, meaning it would take about 16 months to acquire 450 EH.
Even in the most opportunistic of buildouts, assuming the energy infrastructure could be completed in two years (which is highly unlikely because of the utility grade energy needed), the network's hashrate would continue to organically grow throughout this period. Since November 2022, the Bitcoin network's hashrate has been growing an average of 50% on a rolling 12-month basis according to data from Glassnode as of June 30, 2026. Assuming a 34.7% annual forward growth (to apply some conservatism in our analysis) and assuming it would take only two years to acquire all the mining equipment and build the hyperscale-grade energy infrastructure, that would result in the network hashrate growing to over 1,700 EH/second.
Network growth reduces achievable attacker share over time
Time-adjusted model detail: additive vs. displacement ($0.03/kWh)
| Case | Period | Honest EH/s | Attacker EH/s | Total EH/s | Attacker share | Difficulty (T) | Electricity cost/day ($) |
|---|---|---|---|---|---|---|---|
| Additive | Pre-retarget | 1,705.11 | 0.00 | 1,705.11 | 0.0% | 247.87 | $5,823,223 |
| Additive | Post-retarget | 1,705.11 | 479.28 | 2,184.39 | 21.9% | 317.54 | $5,823,223 |
| Displacement | Pre-retarget | 1,705.11 | 0.00 | 1,705.11 | 0.0% | 247.87 | $5,823,223 |
| Displacement | Post-retarget | 1,364.09 | 479.28 | 1,843.36 | 26.0% | 267.96 | $5,823,223 |
Price declines eliminate attacker profitability under time-adjusted scenarios
Price collapse vs. cost curve (time adjusted, additive share only with $0.03/kWh energy costs)
| BTC price decline | BTC price after shock | BTC/day mined (additive share) | Gross mining revenue/day | Electricity cost/day ($) | Gross profit/day |
|---|---|---|---|---|---|
| 0% | $75,787 | 77.07 | $5,841,025 | $5,823,223 | $17,802 |
| 10% | $68,209 | 77.07 | $5,256,922 | $5,823,223 | ($566,301) |
| 20% | $60,630 | 77.07 | $4,672,820 | $5,823,223 | ($1,150,403) |
| 30% | $53,051 | 77.07 | $4,088,717 | $5,823,223 | ($1,734,506) |
| 40% | $45,472 | 77.07 | $3,504,615 | $5,823,223 | ($2,318,608) |
| 50% | $37,894 | 77.07 | $2,920,512 | $5,823,223 | ($2,902,711) |
Again, this reinforces the notion that the honest use of mining resources can be rewarded. The time-delayed analysis suggests the attacker only ends up with 22% of network hashrate, which it can mine profitably on a gross-profit basis at $75,787 (assuming they have the lowest energy costs). As bitcoin's price falls, the operational losses could significantly increase. Using higher assumptions for energy costs, the operation could result in steeper losses, even with no bitcoin price change.
Higher energy costs materially worsen attacker economics, increasing sustained losses
Time-adjusted model detail: additive vs. displacement ($0.10/kWh)
| Case | Period | Honest EH/s | Attacker EH/s | Total EH/s | Attacker share | Difficulty (T) | Electricity cost/day ($) |
|---|---|---|---|---|---|---|---|
| Additive | Pre-retarget | 1,705.11 | 0.00 | 1,705.11 | 0.0% | 247.87 | $19,410,743 |
| Additive | Post-retarget | 1,705.11 | 479.28 | 2,184.39 | 21.9% | 317.54 | $19,410,743 |
| Displacement | Pre-retarget | 1,705.11 | 0.00 | 1,705.11 | 0.0% | 247.87 | $19,410,743 |
| Displacement | Post-retarget | 1,364.09 | 479.28 | 1,843.36 | 26.0% | 267.96 | $19,410,743 |
High energy costs might generate persistent attack losses
Price collapse vs. cost curve (time adjusted, additive share only with $0.10 kWh energy costs)
| BTC price decline | BTC price after shock | BTC/day mined (additive share) | Gross mining revenue/day | Electricity cost/day ($) | Gross profit/day |
|---|---|---|---|---|---|
| 0% | $75,787 | 77.07 | $5,841,025 | $19,410,743 | ($13,569,718) |
| 10% | $68,209 | 77.07 | $5,256,922 | $19,410,743 | ($14,153,821) |
| 20% | $60,630 | 77.07 | $4,672,820 | $19,410,743 | ($14,737,923) |
| 30% | $53,051 | 77.07 | $4,088,717 | $19,410,743 | ($15,322,026) |
| 40% | $45,472 | 77.07 | $3,504,615 | $19,410,743 | ($15,906,128) |
| 50% | $37,894 | 77.07 | $2,920,512 | $19,410,743 | ($16,490,231) |
Under highly favorable assumptions—including sustained access to ultra-low-cost power (about $0.03/kWh), stable bitcoin pricing, and efficient capital deployment—a large-scale operator could potentially generate significant mining cash flow and achieve relatively short payback periods on invested capital. However, these outcomes are highly sensitive to energy costs, bitcoin price, and supply constraints. They also don't incorporate the potential market and network responses associated with majority control and only capture gross profits, not total operating costs. Assuming the attacker could generate a daily gross profit of approximately $1.8 million under our most optimistic scenarios, they could theoretically generate about $659 million in annual gross profit. That's for an operation that required about $15.2 billion in capex (including both mining-rig capex and energy-infrastructure capex) and would require approximately 23 years to pay back—not incorporating the tax treatment that comes with depreciating assets. Even incorporating a double-spend value of $350 million, due to the inability to sustainably capture double spend, our analysis finds the return on investment for the attacker does not pay off.
Our analysis suggests that large-scale mining operations can be economically viable under certain conditions, but it likely overstates the feasibility of a sustained and economically attractive 51% attack. A 51% attack is not "impossible"—but it may only be economically plausible in a very narrow, highly fragile set of conditions that likely break under scale, market response, and supply constraints.
Valuing bitcoin from the lens of a 51% attack
A potential fair value (FV) model for bitcoin can be framed as the interaction of five constraints that impact three core blockchain features—decentralization, security, and scalability. This suggested valuation framework is illustrative, assumption-dependent, not predictive, not a price target, not investment advice, and is based on assumptions that may change materially over time. With that in mind, it's important to examine those five constraints:
- Fixed supply (fixed supply): inelastic issuance that drives scarcity and price formation.
- Energy barrier (physics): the cost to produce blocks and rewrite history.
- Game Theory (competition): ongoing miner rivalry that enforces that cost.
- Probability (uncertainty): stochastic block production and attack success risk. Stochastic refers to a process that is inherently probabilistic, where outcomes are influenced by chance and can only be described in terms of likelihoods rather than certainty.
- Limited extractable value (security constraint): bounded potential economic upside from attacks.
Bitcoin is shaped by these five interacting constraints that jointly determine its decentralization, security, and scalability trade-offs. Fixed supply creates a hard monetary constraint that may contribute to scarcity and long-term value, while the energy barrier imposes a physical cost on block production and history rewrites, anchoring security in real-world resources.
Competition among miners acts as a game-theoretic enforcement mechanism, ensuring that this cost is continuously maintained through entry and exit dynamics. This reduces the likelihood of sustained economic rents, which are persistent excess profits.
At the same time, uncertainty in block production introduces probabilistic finality—meaning transactions become more secure over time, but never instantaneously—limiting throughput and contributing to latency. Throughput is the number of transactions a network can process over a given period.
Finally, limited extractable value bounds the economic incentive for attacks, as the potential gains from double-spends, censorship, or maximum extractable value (MEV) are constrained relative to the cost of execution. Censorship is the intentional delaying, blocking, or exclusion of transactions from the network. Together, these constraints may support network security through decentralization, while also imposing inherent limits on scalability, reflecting a system optimized for trust minimization rather than transaction speed.
A potential fair value model for bitcoin

For illustrative purposes only.
We use estimated miner production costs as one point-in-time fair value metric as they are readily available and can be easily calculated. Bitcoin's limited supply is one feature of its price, as it cannot respond to new demand through increased production, though it is more difficult to calculate its value in real time.
Price (P) can be calculated as the greater of scarcity value or security floor, or max(Scarcity Value or Security Floor). In this framework, that means bitcoin's value is based on either the value implied by scarcity or the minimum value suggested by the cost of maintaining network security, depending on which estimate is greater.
Scarcity value (shown as P*, or the scarcity-implied price/value) is calculated by dividing the demand for bitcoin by its effective float (the number of bitcoin available for public trading), or (P* = Demand / Float). We define security floor as the minimum economic cost required to sustain network security. This includes miner cost of production and the level of hashrate required to prevent attacks. It's important to note that price and production costs can influence one another. Market prices often affect production economics and the incentives for miners to participate in the network, while production costs may influence supply dynamics over time. However, bitcoin's price is influenced by many factors, including investor demand, market sentiment, adoption, liquidity, and macroeconomic conditions, and should not be viewed as determined solely by production costs.
A competition-enforcement multiplier (Mcompetition) is a function of competition elasticity—or how fast competition responds to the profitability of mining bitcoin. This can be calculated by dividing the change in difficulty between two periods (t +14 days, where t is the current point in time being measured) by the change in hashprice (the revenue a miner earns per unit of hashrate) from the previous two most recent periods (t – 14 days). That formula is: ∆Difficultyt+14d / ∆Hashpricet-14d.
In bitcoin mining, strategic participants are the miners, the strategy is to add or remove hashrate, the payoff is profitability, and the constraint is competition from other miners. What we are trying to analyze is when mining becomes more profitable, how aggressively do competitors enter the system?
Probabilistic Finality (Muncertainty) measures the probability that an attacker can successfully override the honest chain, given relative hashrate and confirmation depth (the number of blocks added before the most recent set of transactions). Each block that is mined is an independent event, and there is a randomness here where a block can be mined sooner or later than 10 minutes. This multiplier takes into the account the probability that an attacker catches up to the honest chain, based on their share of network hashrate and number of confirmations they waited for.
To calculate the probability of a successful attack (P_attack), we use P_attack = e^[-2 × (1 − 2q) × z]. Euler's number (2.71828) is represented by e. This is the standard number used in formulas that model continuous change—such as low probabilities, growth, or decay calculations. In our case, we use e to help estimate how quickly the probability of a successful attack declines as more blocks are added. Similar to pi (𝜋)—another mathematical constant that represents the ratio of a circle's circumference to its diameter—e is a universal constant.
The attacker's share of total hashrate is represented by q, while z represents the number of blocks that come after the block the attacker is looking to alter. For example, if an attacker wants to change block 100, and there are three blocks following that block—block 101, block 102, and block 103—there are three confirmations. The equation shows that small increases in confirmations (z) lead to an exponential decrease in the probability of a successful attack (P_attack).
Because this probability becomes extremely small and difficult to interpret, we apply a logarithmic transformation to convert it into a more intuitive and comparable security score. Block production follows independent Bernoulli trials, where each block represents a success or failure based on the miner's share of hashrate.
While the probability of consecutive success declines exponentially, our analysis captures this behavior more rigorously through a continuous probability framework, represented as: Scoreuncertainty = -10 x log10(P_attack). The base-10 logarithm ("log10)" converts extremely small probabilities into numbers that are easier to read and compare. The "10" refers to the mathematical scale used in the calculation. The "-10" is simply a scaling factor that converts the result into a positive security score. Under this approach, a lower probability of attack produces a higher security score.
The next transformation makes sure the resulting values from Scoreuncertainty are stable, so we restrict (clamp) the score to keep it within a minimum and maximum range suitable for use in our analysis:
Scoreuncertainty = min[100,max(0, -10 x log10(P_attack)]
The final step in determining the probabilistic finality multiplier (Muncertainty) is to map Scoreuncertainty to the actual multiplier. This translates the uncertainty score (Scoreuncertainty) calculated above into a price impact. This means the blockchain is potentially rewarded if there is an extremely low probability of attack, unchanged for a moderate likelihood, and penalized for a high probability of attack. This is expressed as:
Muncertainty = Mminimum + (Mmaximum - Mminimum) x (Scoreuncertainty / 100)
Mmaximum = 1.05
Mminimum = 0.95
The last multiplier is the Limited Extractable Value, which we denote as Mattack. This determines how much can actually be stolen in a successful 51% attack. This is our security constraint:
Mattack = AdjustedAttackcost / (AdjustedAttackcost + EVattack)
EV = Extractable Value
EVattack = (Max Double-Spend Value + Max Extractable Value Opportunity + Censorship / Ransom Value)
A realistic base case for bitcoin may assume a max double-spend value of approximately $100 million to $300 million, reflecting large exchange withdrawals or institutional transfers that could plausibly be reversed. Max Extractable Value is much smaller at approximately $1 million to $5 million, driven by transaction fees and ordering over a short attack window. Censorship or ransom value is estimated at approximately $10 million to $50 million, based on a small share of daily transaction throughput or disruption costs.
Under our assumptions, in aggregate, EVattack falls in the approximately $150 million to $350 million range, which, while large in absolute terms, remains modest relative to the approximately $5 billion to $10-plus billion of value bitcoin settles on-chain each day, according to data from Glassnode, as of August 13, 2026. It's also important to note that EVattack is an upper bound and assumes the attacker captures the full amount under pre-attack conditions. We explored above how the network might respond to this, thus resulting in a lower value.
Next, we calculate Attackcost. This puts the cost of conducting the attack into perspective by comparing it with what could be gained from the attack. We highlighted potential costs of attempting a 51% attack in the first part of this article, which could range from $10 to $15 billion to build out the total infrastructure needed, with ongoing energy costs of $5 million to $20 million. Even if an attacker were to capture $200 million once, our analysis suggests they would still be deeply in the negative based on their total investment. Game theory weakens this concept because other participants are likely to respond in their own economic self-interest. Honest miners could respond to the attack with a fork that rejects the attacker's chain, exchanges could freeze the attacker's accounts, and the broader network could refuse to recognize the dishonest chain—reducing or eliminating the attacker's ability to profit.
We also incorporated a Concentration Impact to capture how network centralization affects the ability to coordinate an attack. More concentrated networks may make it easier for a smaller group of participants to control sufficient hashrate, which increases the feasibility and likelihood of a successful attack. To determine the concentration impact, the Herfindahl-Hirschman Index (HHI) is useful.
HHI measures market concentration to evaluate competitiveness and antitrust risks. HHI is calculated as the square of each participant's market share. An HHI below 1,500 is considered a highly competitive market, 1,500-2,500 is considered a moderately concentrated market, while above 2,500 is considered highly concentrated. We used each mining pool's share of hashrate to determine network concentration because there is not public data available for individual ZCash (another decentralized cryptocurrency) miners.
Once we've calculated the HHI, we divide by 10,000 to convert it to a standard scale. We then subtract the standardized HHI Index value from 1.0. The more concentrated the network, the larger the penalty. This is expressed as: Concentration Impact = 1 - (HHI / 10,000).
The concentration impact then is used to adjust the cost of attacking the network:
AdjustedAttackcost = Attackcost x Concentration Impact
With all the inputs into the fair value analysis complete, the point-in-time fair value can be calculated. We use this model to evaluate how Bitcoin's fair value compares with that of Zcash using a consistent analytical framework. Zcash is a proof‑of‑work-based cryptocurrency launched in 2016 and built as a modified version of Bitcoin with a focus on enabling private, confidential transactions. Like Bitcoin, it has a fixed supply of 21 million coins, uses mining to secure the network, and operates on a decentralized public blockchain.
The key difference is that while Bitcoin transactions are fully transparent, Zcash uses zero‑knowledge proofs (called zk‑SNARKs) to allow users to optionally shield transaction details, hiding the sender, receiver, and amount. Another major difference between the two is Zcash is much smaller—it has a $7 billion market cap and nearly 17 million circulating tokens, compared to bitcoin's $1.2 trillion market cap and 20 million circulating tokens according to Token Terminal as of June 26, 2026.
Higher attack costs could preserve bitcoin's fair value, while lower-cost networks face material security discounts
| Component | Bitcoin | Zcash |
|---|---|---|
| P (Base Value) | $75,000 (current price) | $575 (scarcity-implied price) |
| M_competition | 1.01 | 0.97 |
| M_uncertainty | 1.02 | 0.97 |
| HHI (mining pool-based) | ~1,500 | ~2,200 |
| Concentration Impact | 1 − 0.15 = 0.85 | 1 − 0.22 = 0.78 |
| AttackCost (baseline) | $10B | $25M |
| AdjustedAttackCost | $10B × 0.85 = $8.5B | $25M × 0.78 = $19.5M |
| EV_attack | $200M | $15M |
| M_attack | 8.5 / (8.5 + 0.2) ≈ 0.98 | 19.5 / (19.5 + 15) ≈ 0.565 |
| Final Calculation | 75,000 × 1.01 × 1.02 × 0.98 | 575 × 0.97 × 0.97 × 0.565 |
| Fair Value (FV) | $75,719.70 | $305.67 |
Wrapping it all up
Under the assumptions, our analysis suggests that a 51% attack could be costly and complex, making it difficult to attack the Bitcoin blockchain and potentially making it more secure. As a result, bitcoin's valuation may be supported, in part, by the high estimated cost of a 51% attack relative to any potential extractable value attackers could gain.
By comparison, networks with lower estimated attack costs or greater concentration may face different security trade-offs than Bitcoin, depending on network design, hashrate, participation, and other factors. This could lead to a lower valuation when compared to bitcoin.
Many mainstream investors place little premium on the decentralization and security aspects of a cryptocurrency, but these aspects are important to the value of a cryptocurrency. These characteristics may not be fully reflected in market prices, but weaknesses in decentralization or security could become important valuation considerations.
It's important to note that all cryptocurrencies are relatively new and due to their novel and unproven nature, reliable methods for estimating performance may not be available. The regulatory landscape for crypto is still evolving. Cryptocurrencies may be subject to potential encryption breaking, illiquidity, and increased risk of loss. Theft, scams, and fraud have been a factor to deal with, and if you decide to invest in crypto directly remember that there may not be an effective way to recover assets if they're stolen or lost. Investing in cryptocurrencies involves risk, including the risk of total loss of principal invested. Cryptocurrencies such as bitcoin, Ether, XRP, Sol, and Zcash are highly volatile, are not backed or guaranteed by any central bank or government; are not deposits; are not FDIC insured; are not SIPC protected; and lack many of the regulations and consumer protections that legal-tender currencies and regulated securities have. Spot markets on which cryptocurrencies trade are relatively new and largely unregulated, and therefore, may be more exposed to fraud and security breaches than established, regulated exchanges for other financial assets or instruments. Due to the high level of risk, investors should view digital currencies as a purely speculative instrument.