4 Ways Traders Spot a Rally's Potential End
Rallies aren't like mountains—there's no telling where the peak is—but there can be hints that an uptrend is headed for a reversal.
Here are four such signs, along with five corroborating patterns that together could indicate to some traders a time to exit.
Sign No. 1: When good news is bad news
It's a strange yet common occurrence: A company delivers a blowout quarter, but investors nevertheless push its stock price lower. Such a counterintuitive move could indicate the good news has already been priced in, something is amiss with the quality of the company's earnings, or simply that a company known for vaulting over earnings estimates has barely cleared them.
Whatever the case, selling on good news can be a sign that investor sentiment may be turning, at least in the near term. To help corroborate a potential pullback, traders could look for patterns that indicate a marked shift to a negative outlook, such as the bearish engulfing candle or dark cloud cover (see "Five bearish patterns").
Sign No. 2: When dip buyers stop getting rewarded
When a stock is in an uptrend, pullbacks can potentially be opportunities to buy the dip on short-term weaknesses; as word spreads that dip buyers are being rewarded by successive rebounds to higher highs, new investors may jump in, which can perpetuate the rally. However, traders might want to pay attention when pullbacks stop enticing such speculation—especially if corroborating signals portend a reversal.
That sinking feeling
🅐 After stock ZYX experienced a weekslong rally, a bearish engulfing candle pattern emerged, suggesting a possible pullback.
🅑 The stock eventually recovered, potentially benefiting traders who bought the dip. However, it also experienced a negative divergence in its relative strength index (RSI)—an oscillating indicator that measures a stock's momentum—which happens when the stock establishes a new high in an uptrend but with a lower peak on its RSI relative to the prior price high.
🅒 The appearance of a second bearish engulfing candle in mid-July—in conjunction with the negative divergence—suggested a potential reversal, which occurred just days later.
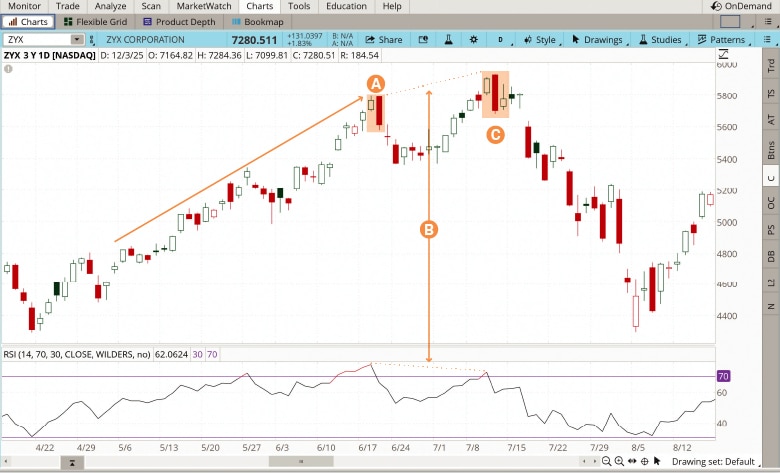
Source: thinkorswim® desktop platform for Mac.
For illustrative purposes only. Individual situations will vary. Not intended to be reflective of results you can expect to achieve.
Sign No. 3: When a sharp top occurs
Accelerations in a stock's price are generally considered a good thing. However, some trajectories are so extreme they enter parabolic territory, where progressively steep price increases can persist for some time but are ultimately unsustainable. These so-called sharp tops often catch traders off guard because reversals can be sudden, triggering stop-loss orders and short positions that intensify bearish sentiment and price declines.
If a stock rises quickly over a short period, traders can watch for ensuing signals of buyer exhaustion and elevated selling pressure, such as higher trading volumes or the advance block and shooting star patterns (see "Five bearish patterns").
Sign No. 4: When a stock closes near the day's lows
When a stock is up and closes near the day's high, it can suggest that the trend may continue. However, when a stock closes near the day's lows, it can signal the opposite—especially if the stock has been testing new highs. For further corroboration, traders can look for patterns, such as the bearish engulfing candle or three black crows patterns (see "Five bearish patterns")—both of which may indicate waning momentum.
Looking at trading volumes from recent trading sessions can add another layer of corroborating evidence. If trading volume was higher on down days than on up days, sellers might soon overtake buyers if given a nudge by negative news.
Five bearish patterns
Reversal patterns on a high-flying stock chart may not mean much in isolation, but they can provide corroborating evidence that might have traders eyeing the exits.
1. Advance block

This pattern occurs during an uptrend and consists of three bullish candles that contain successively smaller bodies, indicating a trend may be petering out.
2. Bearish engulfing candle

This pattern consists of two candles: The first is bullish and continues the uptrend, followed by a second bearish candle whose body completely engulfs the first, signaling a potential downward trend.
3. Dark cloud cover

This pattern features two candlesticks—a large bullish candle representing strong buying pressure during an uptrend, followed by a bearish candle that opens above the previous high but closes below the midpoint of the first candle's body.
4. Shooting star

This pattern forms when the price opens and rallies significantly higher during the session; however, sellers push it back down to close near the opening price, indicating that buyers tried but failed to push the stock higher.
5. Three black crows

This signal consists of three consecutive long-bodied bearish candlesticks that close progressively lower, suggesting selling pressure is increasing and buyers are weakening.
Explore more chart patterns on the thinkorswim® Learning Center.
When to act
Signs that a rally may be coming to an end usually amount to yellow flags, not red ones, so it's important for traders to look for confirming patterns.
When in doubt, scaling out of a position by selling a fraction at a time can be one way traders navigate potentially troubling price action. If they're right, they could save themselves from taking the full hit—and if they're wrong, they can possibly hold on to most of their position.
Discover more from Onward

Keep reading the latest issue online or view the print edition.