3 Ways Volume Can Help Confirm Price Trends

In trading, as in surfing, the best waves are often those with a lot of energy behind them.
However, while a surge in trading volume often indicates strong market conviction behind a price trend, that same momentum can cause a wipeout for traders who don't take proper precautions.
Here are three ways traders can gauge a volume wave's strength and potential duration.
1. Confirm a price move or trend
To judge whether volume is supporting a trend, traders can look for periods of above-average activity, often punctuated by significant spikes. For short sellers, a downtrend accompanied by above-average volume implies investors have doubts about the stock, which could lead to further selling and even lower prices.
Gathering steam
After experiencing several spikes in volume through December and January, stock ZYX's volume consistently exceeded its 🅐 50-day average into February and March, coinciding with a strong upward price trend.
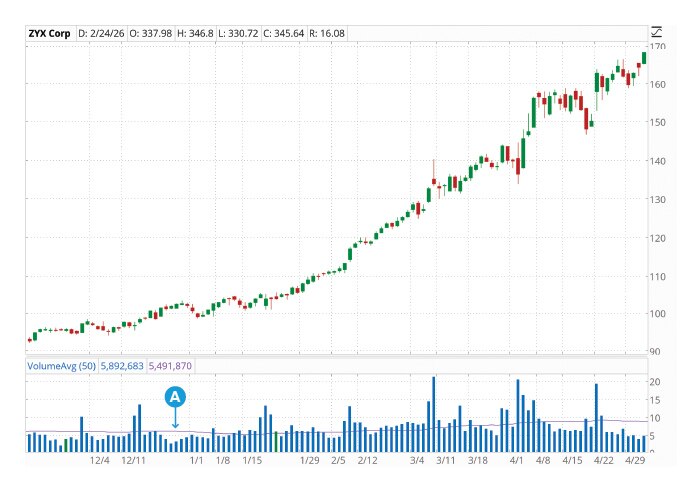
Source: thinkorswim® desktop platform for Mac. Screenshots are for illustrative purposes only, may be historical in nature, and should not be used as a basis for any investment decision.
That said, it can take some time for volume to consistently breach its near-term average, in which case traders may find it helpful to draw a line between near-term volume peaks to identify the general direction. Nevertheless, traders should take care not to try too hard to see a trend where there isn't one—investor interest should be obvious.
To view a stock's current volume versus its 50-day average, log in to the thinkorswim® desktop app and:
- Under Charts, search for a stock to populate its chart.
- Click Studies and hover over Quick Studies, then Market Strength Studies and select VolumeAvg.
2. Get ahead of a breakout or breakdown
Resistance levels backed by high historical volume tend to be more difficult for a stock to breach because they reflect strong market conviction around the stock's upper price limit. If a stock moves above a price level where it has historically experienced high-volume resistance, that could indicate a significant breakout.
History lesson
🅐 For months, stock ZYX struggled to move above its point of control (POC)—the price level with the highest historical volume over the selected period. 🅑 However, it eventually breached its POC in November, indicating a potential breakout. A trader who opened a position at that time could have benefited from the subsequent sharp uptrend. 🅒 Establishing a trailing stop order around the next-highest-volume price level just below the POC could have helped limit losses while continuing to capitalize on the uptrend.
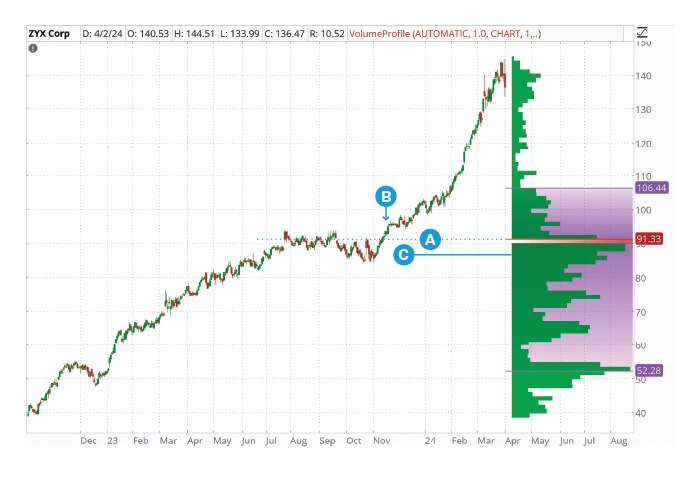
Source: thinkorswim® desktop platform for Mac. Screenshots are for illustrative purposes only, may be historical in nature, and should not be used as a basis for any investment decision.
Conversely, if a stock price moves below a high-volume level of support, a reversal may be imminent.
To identify the price bands where the most trading activity has historically occurred for a given stock, log in to the thinkorswim desktop app and:
- Under Charts, search for a stock to populate its chart.
- Click Studies and hover over Quick Studies, then Market Strength Studies and select VolumeProfile.
- If desired, click D in the chart toolbar to customize the time frame.
3. Time entries and exits for short-term trades
Volume-weighted average price (VWAP) shows a security's average price over a period (usually one day), weighted by trading volume. By monitoring VWAP, traders can get a good idea of the price buyers and sellers agree is fair at a specific time.
For example, when a stock is trading below its VWAP, it suggests sellers are dominating. While the price could be a bargain, traders may want to wait to enter a trade until momentum shifts and the price moves back above this threshold.
Weighting game
🅐 In the five-day, 15-minute chart for stock ZYX, its price gapped down overnight, and 🅑 trading opened below its volume-weighted average price (VWAP) before rallying and rising above it. 🅒 A potential entry would be when the green candle fully breaches the VWAP, which a trader could continue to hold so long as the price stays above its steadily rising VWAP.
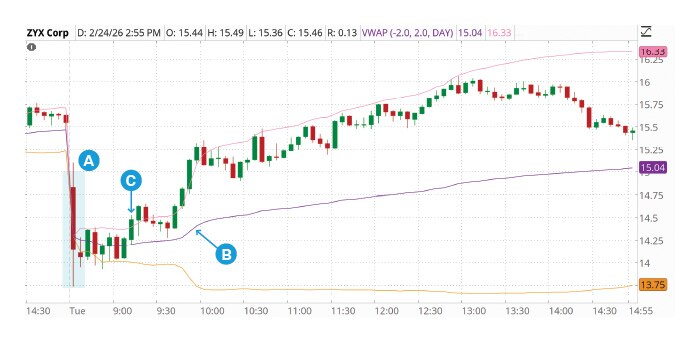
Source: thinkorswim® desktop platform for Mac. Screenshots are for illustrative purposes only, may be historical in nature, and should not be used as a basis for any investment decision.
To view a stock's VWAP, log in to the thinkorswim desktop app and:
- Under Charts, search for a stock to populate its chart.
- Click Studies and hover over Quick Studies, then Market Strength Studies and select VWAP.
- Zoom in until intraday price movements are visible.
Proceed with caution
Volume can be a powerful indicator of momentum, but not all swells are related to trader sentiment. Day traders, in particular, should beware of volume surges around market open and close, which is often the result of market makers rushing to fill orders. Big announcements, such as a Federal Reserve interest rate move, could also generate volume for nontechnical reasons.
High volume can also signal the end of a trend—the final surge of buying and selling before it's completely exhausted. As such, traders should never rely on volume as the sole corroborating signal when researching a trade, but rather one of many to consider before acting.
Discover more from Onward

Keep reading the latest issue online or view the print edition.