What Can Drive Bitcoin's Price?

Key takeaways
- Understanding price drivers can help long-term investors evaluate whether bitcoin may or may not be appropriate for their portfolios, while offering more tactical investors the opportunity to trade bitcoin.
- Long-term drivers include global money supply growth, the four-year halving cycle and bitcoin adoption.
- Short-term drivers include broader market sentiment, interest rates, U.S. dollar strength, seasonality, central bank excess liquidity, the supply of "whale" or larger-size bitcoin wallets, and financial contagions.
If you're considering investing in bitcoin, it may be useful to understand what can drive its price. Like traditional investments such as stocks and bonds, there are macroeconomic drivers as well as bitcoin-specific factors that can affect its performance.
At any time, different factors can be affecting bitcoin, which may result in these factors having less of an impact than they historically have. It is important to look at all the factors to get an understanding ultimately of what may be driving bitcoin's price. That said, there are likely additional factors that are impacting bitcoin's price that we have not covered in this report.
Some of these factors can take years to play out, such as growth in money supply, bitcoin's four-year halving cycle and adoption by new investors. Other factors are more short-term, such as market risk sentiment, interest rates and the value of the U.S. dollar, and capable of causing short-term volatility. Below we will discuss each of these long- and short-term factors to get a better understanding of how they can affect bitcoin's price.
Note that we're focusing on bitcoin primarily because it's the oldest and most widely held cryptocurrency. Nothing in this report is a recommendation to buy or sell bitcoin or any other cryptocurrency or financial product. This is for informational use only. Bitcoin and other cryptocurrencies are relatively new and due to their novel and unproven nature, reliable methods for estimating performance may not be available. The regulatory landscape for crypto, including bitcoin, is still evolving. Bitcoin may be subject to potential encryption breaking, illiquidity and increased risk of loss. Theft, scams and fraud have been a factor to deal with, and if you decide to invest in bitcoin directly remember that there may not be an effective way to recover assets if they're stolen or lost.
One key risk specific to bitcoin is the risk of quantum computing. Quantum computing could derive private keys from public keys, which would result in the theft of older bitcoin addresses. While other blockchains have core development teams that are actively working on solutions to potential disruptions by quantum computing, the bitcoin blockchain has not taken these steps. While other blockchains have gone through more regular network upgrades, bitcoin has not upgraded its network as often, with only two upgrades since 2017.
Historical long-term bitcoin price drivers
An anonymous person (or persons) known as Satoshi Nakamoto launched the bitcoin blockchain in 2009, during the depths of the global financial crisis. While bitcoin was originally designed to be a payments network with its own native currency, over time investors have adopted it as a store of value rather than a means of transacting in everyday goods. In the years since bitcoin's launch, the cryptocurrency asset class as a whole has grown to a $3.4 trillion market capitalization as of December 31st, 2025, according to CoinMarketCap.com. While this may seem large, it pales in comparison to global equities at roughly $125 trillion as of July 2025, according to the Securities Industry and Financial Markets Association (SIFMA); global fixed income at $250 trillion as of July 2025, according to SIFMA; and global real estate at around $400 trillion as of January 2025, according to Savills. Given the relatively small size of the cryptocurrency asset class and its fast-growing nature, it is important to understand the historical drivers of cryptocurrency prices.
Bitcoin is the largest cryptocurrency, with a market cap of $1.7 trillion, which represents 50% of the crypto market cap as of December 31st, 2025, according to Coinmarketcap.com. On December 31st, 2025, bitcoin's price was 30% below its October 2025 all-time peak, according to data from Bloomberg. Given this large share, price movements in bitcoin tend to propel the rest of the asset class—a rising tide lifts all boats, as they say. The long-term drivers of bitcoin's price include M2 money supply growth, bitcoin's four-year halving cycle and the rate at which investors are adopting bitcoin.
Money supply
Increases in money supply reduce the buying power of savings. As new money enters circulation, this creates more demand for the existing stock of goods and services in the economy. Producers respond to this new demand, which helps to expand the economy but at the expense of those who have their savings denominated in local currency.
Money supply is a measure of a country's total currency in circulation. M2 money supply captures all physical currency in circulation, coins and checking accounts (M1), plus savings deposits, retail money market funds and certificates of deposit issued in amounts under $100,000.
Governments and central banks generally are aligned in their goal of growing the economy. During periods of economic stress, they can enact measures to reduce slowdowns and support employment. Often these measures result in increased money supply and are referred to as "money printing."
Since 2010, global M2 money supply has grown 6% annually (January 31st, 2009 to December 31st, 2025), per Bloomberg. Historically there has tended to be a strong relationship between money supply growth and bitcoin price growth, as you can see in the chart below. With aging workforces in many developed economies and high existing levels of sovereign debt, it is likely that governments will continue to rely on strategies such as increasing the money supply and bank reserves, both to grow their economies and to manage their financial obligations. As a result, money supply is likely to continue to support bitcoin prices, as investors globally may seek to preserve the buying power of their savings. It is important to note that just because one factor can be seen as a perceived upside driver to bitcoin's price over the long term, ultimately there are many different factors that can push and pull on bitcoin's price in either direction, and just because one factor seems supportive does not mean it will actually have a direct impact on bitcoin's price.
A period of below average money supply growth or negative money supply growth, which we experienced in 2022 and 2023, could have a negative impact on bitcoin's price.
Historically M2 money supply growth and bitcoin prices have shown a relationship
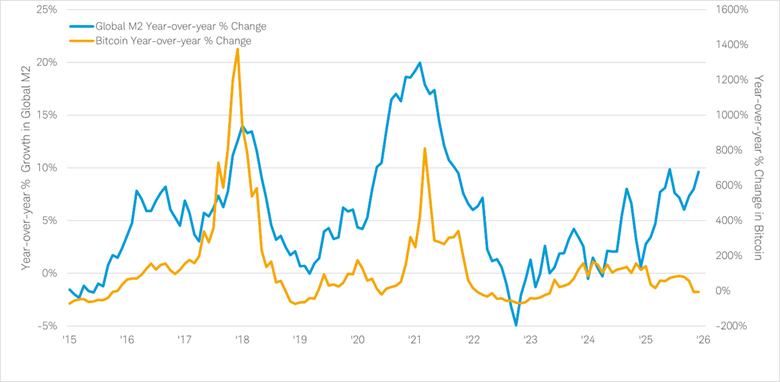
Source: Bloomberg, from 1/1/2015 to 12/31/2025.
Bitcoin is represented by its spot price and does not reflect any transaction fees. For illustrative purposes and are no guarantee of future performance or success. Not intended to be reflective of results you can expect to achieve and are not intended to be, nor should they be construed as, a recommendation to buy, sell, or continue to hold any investment. Past performance is no guarantee of future results.
Bitcoin's four-year halving cycle
Bitcoin is what's known as a "disinflationary currency," one whose purchasing power increases over time because its supply is fixed (unlike "fiat" currencies, such as U.S. dollars or yen, whose supply can be increased by governments or central banks). Roughly every four years, the amount of bitcoin rewarded in the block reward is reduced by half. This event is referred to as "the halving" by bitcoin enthusiasts. Currently the block reward is 3.125 bitcoins, down from 50 when the network went live in January 2009. Only 21 million bitcoins can be mined, with new supply of bitcoin ending in the year 2140.
So far, there have been four halvings—in 2012, 2016, 2020 and 2024. After each halving, a bull market in bitcoin followed (past performance is no guarantee of future results). One rationale for this is that the reduction in new supply of bitcoin creates a supply-and-demand mismatch, like commodity shortages. Traditionally in commodity shortages, this mismatch in supply and demand has resulted in price increases, which often entice speculators to enter the market, pushing prices even higher. Eventually, new supply comes online or higher prices lead to decreased demand that tends to slow price growth.
While bitcoin supply is set, demand can falter as prices rise. Historically these bitcoin cycles have seen 75% to 85% price corrections following their peak. While bitcoin's price may exhibit a boom-bust nature, ultimately new supply is set based on bitcoin's underlying code and cannot be changed. There will only ever be 21 million bitcoins and the amount that is rewarded to miners will decline after each halving until that limit is reached. Over the next decade, new supply of bitcoin will increase by only 4%.
While this boom/bust price action may be shorter-term in nature, the long-term impact is the secular supply-demand mismatch. This relationship assumes that demand for bitcoin will remain stable or increase over time. New supply grows at a slower rate over time, and there is ultimately a finite number of bitcoins that can be mined. Bitcoin is unique in this sense, relative to other currencies globally, because this makes it a "scarce" asset.
Bitcoin prices have risen after past halvings
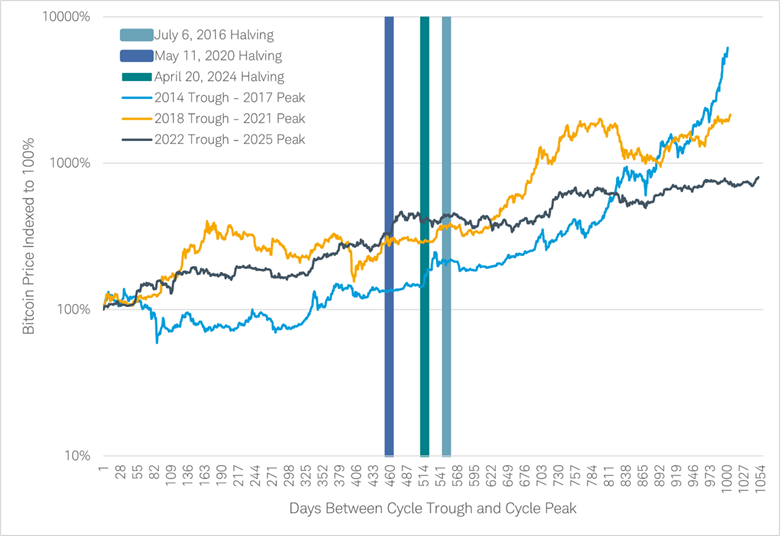
Source: Bloomberg, as of 12/31/2025.
Bitcoin is represented by its spot price and does not include any transaction fees. For illustrative purposes and are no guarantee of future performance or success. Not intended to be reflective of results you can expect to achieve and are not intended to be, nor should they be construed as, a recommendation to buy, sell, or continue to hold any investment. Past performance is no guarantee of future results.
Adoption
Perhaps the strongest of the long-term price drivers, bitcoin adoption has expanded from a small community of technologists to a growing number of everyday investors. In 2013 a private trust for accredited investors that held bitcoin was launched, which eventually became tradable on over-the-counter markets in 2015. Originally bitcoin and bitcoin futures could only be traded on crypto-native exchanges; however, in December 2017 the Chicago Mercantile Exchange and Chicago Board Options Exchange launched futures on their exchanges. This opened cryptocurrency up to a new group of mainstream investors. In October 2021, futures-based exchange-traded products (ETPs) were launched that traded on more liquid exchanges. In early 2024, the SEC approved spot bitcoin ETPs. Along the way, publicly traded companies and governments have begun to acquire bitcoin on their balance sheets.
To calculate a proxy for bitcoin adoption, we measure the year-over-year change in addresses that hold any amount of bitcoin. This includes "cold wallets," which are stored in hard-drive devices not connected to the internet, and "hot wallets," which are held at financial institutions and crypto exchanges. Since 2017, this has resulted in a median growth rate of 17%. We use the median rather than the average growth rate to smooth out short-term increases and decreases due to the boom/bust cycle bitcoin historically has exhibited. It is not perfect, as this assumes an investor only has one wallet. It also does not incorporate exchanges and investment firms which may custody assets for millions of customers in a handful of wallets.
Bitcoin adoption has grown at a median rate of 17% since 2017
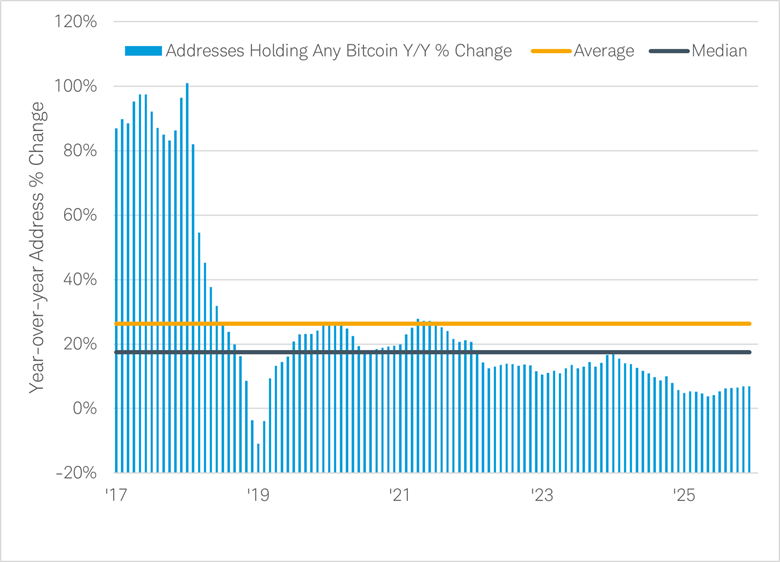
Source: Token Terminal, from 1/1/2017 to 12/31/2025.
For illustrative purposes only.
Another way to estimate adoption is to look at adoption curves of other technologies. The internet is often viewed as a strong proxy for cryptocurrency adoption. Starting in the early 1990s when the internet was not mainstream and measuring its growth through the dot-com era all the way through 2023, we can see that bitcoin has followed a similar adoption rate so far. Assuming bitcoin follows this adoption curve, a more conservative estimate of forward adoption should be roughly 10% per year. If adoption were to slow down, that could have a negative impact on bitcoin's price.
Historical short-term bitcoin price drivers
The combination of these three long-term drivers has propelled bitcoin's secular growth over the past 17 years. This long-term growth has not been without short-term volatility. Understanding these short-term drivers can help investors put recent price changes in perspective. Major short-term drivers include broader market risk sentiment, interest rates, the value of the U.S. dollar, seasonality, central bank excess liquidity, "whale" supply and financial contagions.
Broader market risk sentiment
Bitcoin is a risk asset and as a result is affected by overall investor risk appetite. When investors are more willing to take risk they are likelier to buy bitcoin, but the reverse is also true. One of the best ways to gauge risk appetite is by looking at credit spreads, which measure the difference between a higher-risk corporate bond versus a comparable-maturity U.S. Treasury bond, which is considered to be a "risk-free" investment (because it's backed by the full faith and credit of the U.S. government). When bond investors get nervous, they may sell their investment-grade corporate bonds and invest in Treasury bonds instead. That activity tends to lead to lower corporate bond prices and higher corporate bond yields (because yields typically move inversely to prices). That causes the credit spread to widen.
Often investors think of bitcoin as being like a technology stock. While the bitcoin blockchain does have similar features, specifically a growing digital ecosystem with revenue, network effects and user growth, over the long term it has exhibited relatively little correlation to equities, including technology stocks.
There are periods where bitcoin has been more correlated with equities, while there are periods during which there has been no correlation and strong negative correlations. Ultimately it is important to be aware of bitcoin's current correlation to equities.
Bitcoin's correlation to equity momentum
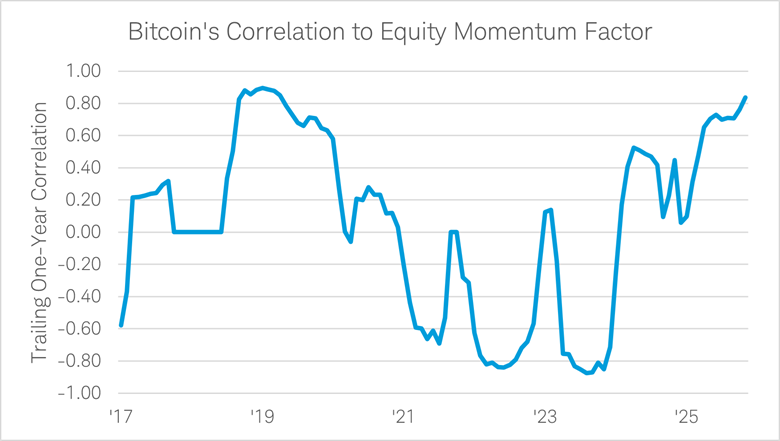
Source: Bloomberg, monthly data from 1/1/2017 to 12/31/2025.
Chart shows the Morgan Stanley US Momentum Index (MSZZMOMO Index). The Morgan Stanley US Momentum Index is a custom index that represents an equal notional pair trade of buying the MSQQUMOL (US Momentum Long) and short-selling the MSQQUMOS (US Momentum Short). Performance reflects each side rebalanced back to equal notional at the close of each trading day. The Morgan Stanley US Momentum Long Basket reflects the top 15% of the most liquid stocks from the Russell 3000 index based on 12-month return. The Morgan Stanley US Momentum Short Basket reflects the bottom 15% of the most liquid stocks from the Russell 3000 index based on 12-month return. Bitcoin is represented by its spot price and does not include any transaction fees. Correlation is a statistical measure of how two investments historically have moved in relation to each other, and ranges from -1 to 1. A correlation of 1 indicates a perfect positive correlation, while a correlation of -1 indicates a perfect negative correlation. A correlation of zero means the assets are not correlated. For illustrative purposes and are no guarantee of future performance or success. Not intended to be reflective of results you can expect to achieve and are not intended to be, nor should they be construed as, a recommendation to buy, sell, or continue to hold any investment. Indexes are unmanaged, do not incur management fees, costs, and expenses, and cannot be invested in directly. Past performance is no guarantee of future results.
Interest rates
Interest rates are an important indicator to follow when considering investing in bitcoin. Historically, bitcoin typically exhibits little correlation to interest rates (as reflected in 10-year Treasury bond yields); in the short-term interest rates can impact bitcoin's price. This is because of the second-order impact of interest rates. When an economy is showing strength, central banks will often raise rates to prevent the economy from overheating, or to combat price inflation. Investor perceptions about the fiscal health of a country can also impact longer-term interest rates. Ultimately, these changes in interest rates impact the price of the U.S. dollar, which has a strong impact on bitcoin prices in the short term.
Bitcoin's correlation to 10-year Treasury bond yields
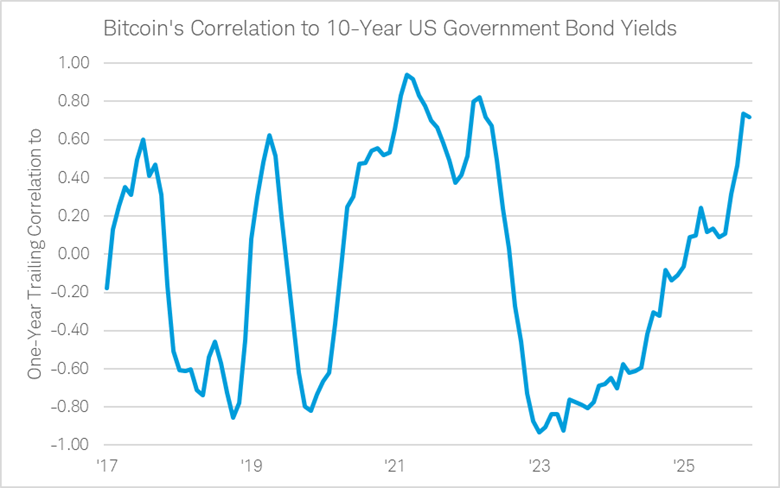
Source: Bloomberg, monthly data from 1/1/2017 to 12/31/2025.
Bitcoin is represented by its spot price and does not include any transaction fees. Correlation is a statistical measure of how two investments historically have moved in relation to each other, and ranges from -1 to 1. A correlation of 1 indicates a perfect positive correlation, while a correlation of -1 indicates a perfect negative correlation. A correlation of zero means the assets are not correlated. For illustrative purposes and are no guarantee of future performance or success. Not intended to be reflective of results you can expect to achieve and are not intended to be, nor should they be construed as, a recommendation to buy, sell, or continue to hold any investment. Past performance is no guarantee of future results.
U.S. dollar and other currencies
Bitcoin is the native currency of the bitcoin blockchain, which functions as a borderless digital currency. Bitcoin historically has shown a strong correlation to emerging-market currencies, as measured by the MSCI Emerging Market Currency Index (USD). There are periods when this correlation has broken down, which historically has been around halvings, an event specific to bitcoin. An emerging-market currency will typically strengthen against the U.S. dollar as the issuing country's economy grows and as trade increases between it and other countries, resulting in more demand for its currency. An emerging-market currency would also strengthen as its population grew, either organically or from immigration, resulting in stronger adoption of the currency.
In that sense, bitcoin is like an emerging-market currency and as more investors have adopted it and transacted with it, bitcoin has strengthened against the dollar. One of the reasons for considering bitcoin is to maintain the purchasing power of savings. In bitcoin terms, as the dollar's buying power is reduced, bitcoin may experience increasing prices. Often investors choose to invest in stocks, real estate and cryptocurrencies. They may be assuming those assets will rise in value faster than the dollar. Sharp periods of dollar strength put corresponding pressure on non-dollar-denominated assets globally. As a result, bitcoin has had a negative correlation to the U.S. dollar. Periods where bitcoin's correlation to the dollar rises have tended to occur around halvings, which is specific to bitcoin.
Bitcoin correlation to emerging-market currencies and to the U.S. dollar
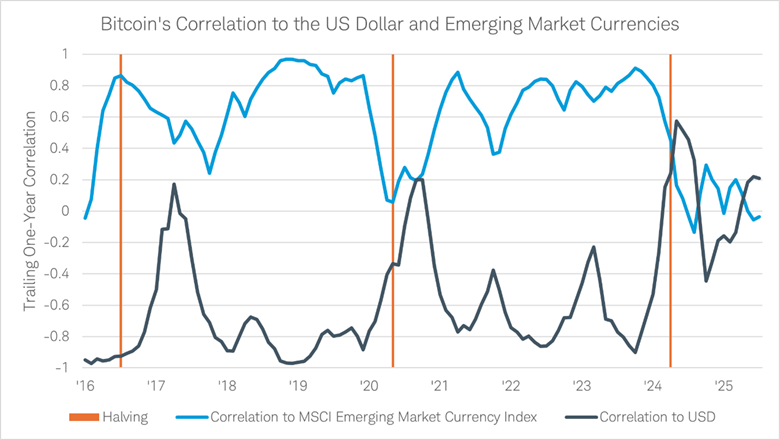
Source: Bloomberg, monthly data from 1/1/2016 to 12/31/2025.
For illustrative purposes and are no guarantee of future performance or success. Not intended to be reflective of results you can expect to achieve and are not intended to be, nor should they be construed as, a recommendation to buy, sell, or continue to hold any investment. Indexes are unmanaged, do not incur management fees, costs, and expenses, and cannot be invested in directly. Correlation measures the strength and direction of a linear relationship between two variables, and ranges from -1 to 1. A correlation of 1 indicates a perfect positive correlation, while a correlation of -1 indicates a perfect negative correlation. A correlation of zero means the assets are not correlated. In this case we have measured the correlation between the changes in bitcoin's price and changes in MSCI Emerging Market Currency Index price. We separately measured the correlation between bitcoin and the U.S. dollar.
Seasonality
Bitcoin has traditionally exhibited seasonality. Since 2011, when taking every calendar year into account and using median returns, the weakest months for bitcoin returns have been March, August and September. We have also provided the historical seasonality based on years relative to bitcoin's halving, as this is a metric that many investors follow. Given bitcoin's volatility and outsized moves that occurred from its launch in 2009 and through 2016, it may be better to track seasonality using median returns instead of average monthly returns. Bitcoin's four-year halving cycle historically has been a very important event, typically kicking off bull markets followed by deep bear markets. Understanding the average monthly returns in the year of and the year following a halving can be helpful. However, this also results in much smaller set of observations, so there is the risk of "cherry picking" (that is, using only the best results) via this method. Either way it is helpful to understand how bitcoin has acted seasonally across all periods, and how the halving could potentially result in different seasonality.
Regardless of bitcoin's historical seasonality patterns, past performance is no guarantee of future results. Seasonality alone should not be the only factor in deciding whether to invest and risk tolerance and goals must be considered. Below is an exhibit of bitcoin's historical seasonal patterns. It is important to note that bitcoin is highly volatile. Typically, we would not include data as far back as 2011, as the growth from that period is unlikely to repeat in the future. In this case we have included the data, because the seasonal patterns are still a factor in earlier years, but the degree that bitcoin has moved during those months has become smaller over time.
Average monthly returns from 2011-present
| Month | All years | Halving year 1 | Halving year 2 | Halving year 3 | Halving year 4 |
|---|---|---|---|---|---|
| January | 10.6% | 11.7% | 18.4% | 1.4% | 6.0% |
| February | 14.8% | 10.2% | 27.2% | 7.7% | 17.3% |
| March | 10.0% | -3.4% | 47.4% | 8.7% | -4.5% |
| April | 28.6% | 7.9% | 21.3% | 9.4% | 10.0% |
| May | 22.4% | 10.0% | 9.8% | 17.6% | 11.8% |
| June | 7.4% | 10.9% | -4.3% | 19.5% | 5.1% |
| July | 8.9% | 16.0% | 11.0% | -2.3% | 7.8% |
| August | -1.4% | -1.6% | 25.2% | -11.3% | -5.1% |
| September | -4.0% | 6.9% | -3.4% | -2.5% | 1.9% |
| October | 15.0% | 11.3% | 37.8% | 25.3% | 18.3% |
| November | 35.5% | 24.1% | 119.9% | 3.1% | 28.1% |
| December | 7.2% | 20.5% | -2.9% | 6.7% | 24.8% |
Median monthly returns from 2011-present
| Month | All years | Halving year 1 | Halving year 2 | Halving year 3 | Halving year 4 |
|---|---|---|---|---|---|
| January | 8.0% | 14.4% | 10.7% | -7.0% | -0.1% |
| February | 11.0% | 3.7% | 31.4% | 11.0% | 15.0% |
| March | -2.1% | -2.0% | 14.1% | 7.6% | -3.9% |
| April | 9.2% | 5.5% | 20.5% | 3.4% | 9.2% |
| May | 7.7% | 10.3% | 3.0% | -2.0% | 13.0% |
| June | 5.4% | 11.9% | -1.5% | 12.6% | -3.8% |
| July | 8.3% | 14.2% | 11.8% | -3.9% | 4.3% |
| August | -8.4% | -2.9% | 21.4% | -10.9% | -8.7% |
| September | -3.8% | 7.0% | -3.4% | 2.9% | 5.9% |
| October | 11.5% | 12.8% | 46.6% | 28.0% | 15.9% |
| November | 8.9% | 25.4% | 22.5% | 8.9% | 38.5% |
| December | -3.2% | 17.8% | -11.4% | 12.6% | 28.1% |
Excess central bank liquidity
One area that cryptocurrency investors may follow is excess liquidity at central banks, such as the Federal Reserve. This is a metric that serves as a proxy for the flow of money throughout the economy. The idea behind this metric is that there are periods where the government is injecting money into the economy, and periods when it is pulling from the economy.
As the government depletes the Treasury general account, it puts money into the economy through payrolls and purchases. In the U.S., banks currently have no reserve ratios and thus are encouraged to lend all deposits into the economy. Banks often store excess deposits in the Federal Reserve's reverse repurchase, or repo, facility. Putting reserves into reverse repos pulls money off bank balance sheets that could otherwise be lent into the economy. Finally, the Federal Reserve's balance sheet is used to increase and decrease demand in the economy, through quantitative easing and quantitative tightening.
Excess central bank liquidity can be proxied by calculating the net change in the size of the Fed's balance sheet, reserves held in reverse repos (when bank is temporarily lending its excess cash to the Federal Reserve in exchange for securities—usually Treasury bonds, and earns a set interest rate), and the Treasury general account. This daily net change can then be turned into an index, which can be tracked directionally. As excess liquidity makes it way throughout the economy, it eventually ends up in a savings account—in the form of a financial asset, which includes stocks, bonds, cryptocurrencies and real estate, resulting in higher asset prices.
In periods where the Treasury general account is being refilled—such as tax season or after a budget reconciliation bill is passed, this pulls money out of the economy. When the Fed is letting bonds roll off its balance sheet as opposed to reinvesting or actively buying and increasing the size of the balance sheet, this results in less circulating money. When banks have excess reserves and need somewhere to store them short-term, they can earn an attractive yield in reverse repo agreements, which ultimately shifts money out of deposits that would otherwise be lent out into the economy.
Periods where excess liquidity is trending higher tend to be positive for bitcoin, while periods where excess liquidity trends lower can be negative for bitcoin.
Bitcoin prices vs. Federal Reserve excess liquidity
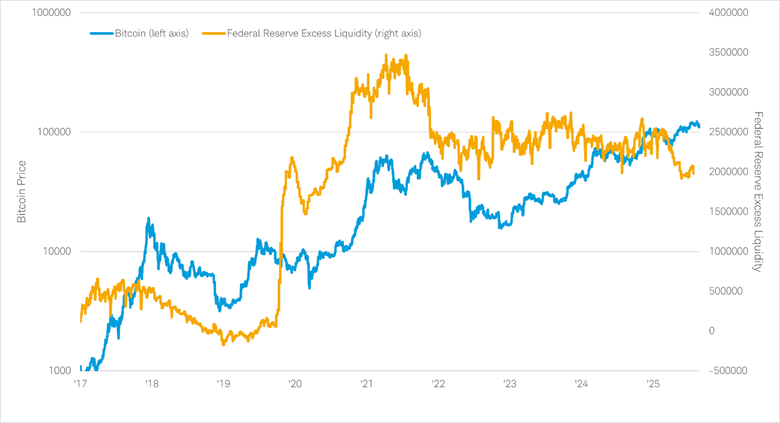
Source: Bloomberg, monthly data from 1/1/2017 to 12/31/2025.
Note: Federal Reserve Excess Liquidity is calculated by taking the daily change in the Reverse Repo Facility (the total amount of bank reserves that have been lent to the Federal Reserve as reverse repos), the daily change in the Fed Balance Sheet, and the daily change in the Treasury General Account. The change in reverse repo and Treasury general account are then subtracted from the change in the Fed's balance sheet. This results in a net liquidity increase/decrease on a given day. This data series is a cumulative sum of these changes. For illustrative purposes and are no guarantee of future performance or success. Not intended to be reflective of results you can expect to achieve and are not intended to be, nor should they be construed as, a recommendation to buy, sell, or continue to hold any investment. Past performance is no guarantee of future results.
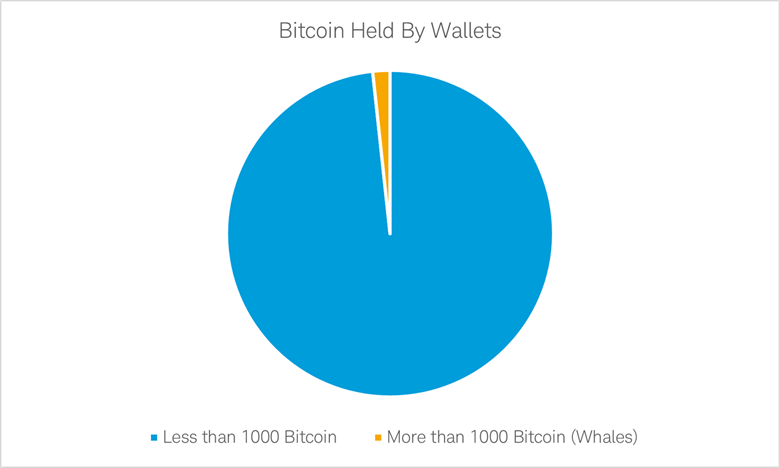
Whale supply
"Whale" wallets are bitcoin wallets that hold more than 1000 bitcoins. Of the nearly 1.5 million bitcoin wallets, whale wallets only represent about 2% of total wallets; however, they control more than 50% of circulating bitcoin, according to blockchain data provider Glassnode as of December 31st, 2025. Some of these wallets may be cryptocurrency exchanges or other institutional pools that hold bitcoin on behalf of millions of investors, but others are bitcoin owners who acquired a substantial amount of bitcoin in the very early days of the protocol. As a result, these whale wallets can have a major impact on bitcoin prices if they choose to sell.
Similar to a large institutional investor in an equity, whales must balance market impact and trade completion—the faster they choose to liquidate their position, the more it can affect market prices. Given the decentralized nature of bitcoin, whale wallets can be tracked in real time. As a result, a whale wallet that has been dormant for a long period of time that comes online may result in investors proactively selling. Just because a wallet comes online does not mean the whales will sell. Sometimes they are just transferring to a new wallet. Regardless, understanding the actions of whales is a very important metric to follow in the short term.
Whale wallets represent about 2% of total wallets
Source: Schwab Center for Financial Research, Glassnode, as of 12/31/2025.
For illustrative purposes only.
Whale wallets control more than 50% of circulating bitcoin
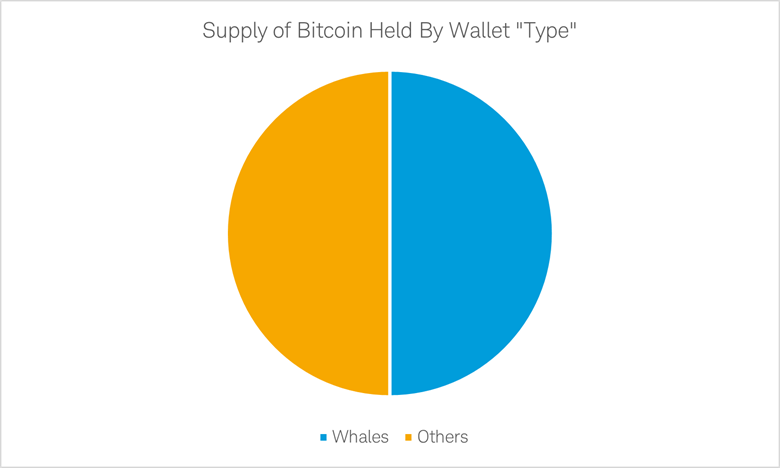
Source: Schwab Center for Financial Research, Glassnode, as of 12/31/2025..
For illustrative purposes only.
Financial contagion
Financial contagion is a term for market disturbances that spread from one country to another. This is typically a risk-off scenario, but bitcoin tends to go against that trend. While other asset classes may react negatively to issues related to financial contagions, such as bank runs, bitcoin so far has exhibited strength in these periods, though past performance is no guarantee of future results. For example, in the banking crisis of 2023, during which Credit Suisse, First Republic, Silicon Valley Bank and Signature Bank failed, bitcoin had initially been in a bear market along with stocks for all of 2022 and into 2023, but rallied when the market started to discount the potential of these bank runs. Prior to these bank runs, bitcoin had been on a downtrend as the Fed's rate-hike cycle and global risk-off environment kept pushing the U.S. dollar higher.
Bitcoin rallied in 2023 while certain bank stocks fell
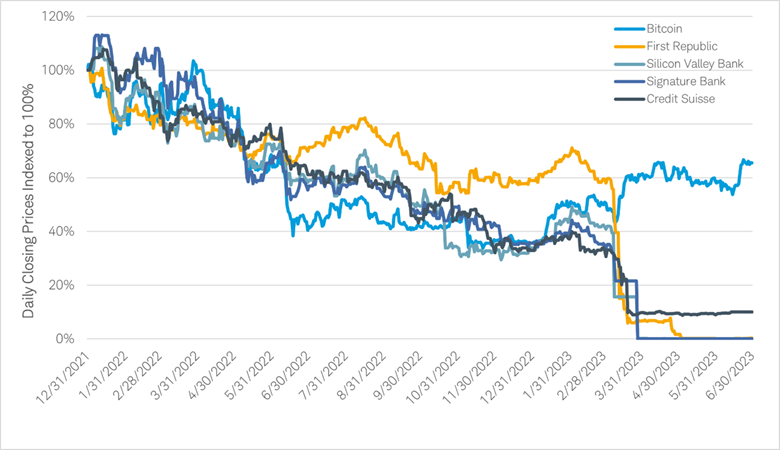
Source: Bloomberg as of 6/30/2023 (after this date the four banks no longer existed).
For illustrative purposes and are no guarantee of future performance or success. Not intended to be reflective of results you can expect to achieve and are not intended to be, nor should they be construed as, a recommendation to buy, sell, or continue to hold any investment. Past performance is no guarantee of future results.
Risks to consider
Investing in cryptocurrencies involves risk, including the risk of total loss of principal invested.
Cryptocurrencies such as bitcoin are highly volatile, are not backed or guaranteed by any central bank or government; are not deposits; are not FDIC insured; are not SIPC protected; and lack many of the regulations and consumer protections that legal-tender currencies and regulated securities have. Due to the high level of risk, investors should view digital currencies as a purely speculative instrument. Cryptocurrency-related products carry a substantial level of risk and are not suitable for all investors. Investments in cryptocurrencies are highly speculative, and may be subject to extreme price volatility. Spot markets on which cryptocurrencies trade are relatively new and largely unregulated, and therefore, may be more exposed to fraud and security breaches than established, regulated exchanges for other financial assets or instruments. Some cryptocurrency-related products use futures contracts to attempt to duplicate the performance of an investment in cryptocurrency, which may result in unpredictable pricing, higher transaction costs, and performance that fails to track the price of the reference cryptocurrency as intended. Before considering any fund, you should consult the fund's prospectus to understand its investment objectives, risks, charges, and expenses. Additional risks apply.
Taking it all in
Cryptocurrencies are still a new asset class. When considering whether to invest in bitcoin it is important to understand what can drive its price, but also what if any level of exposure might be right for you. There are several ways to gain exposure, whether through spot cryptocurrency, crypto ETPs, derivatives, and crypto-related stocks, and ultimately investors must determine what is the best method for their own personal goals and risk tolerance.